class: title-slide background-image: url(addtl_images/patterns_cover_3.png) background-size: cover --- class: inverse-intro, left, middle # .my-black[About This Zine] .pull-left[ .my-black[ Welcome to my #rstats zine. On December 13th, I shared two images on Twitter with a facetious comment on how I only start mini side projects when I'm stressed. I had no set goals other than to make things visually appealing to myself. I wasn't even sure I would share more than the initial two. It evolved into this project. There are 30 ~unique~ computational art pieces with accompanying code deep diving into radial objects. They are categorized by themes, but the order of completion is also indicated. All of these are coded in R. There is also accompanying tips to create/recreate visualizations. You could consider this zine my 30 piece love letter to the polar coordinate system. ] ] .pull-right[ .my-white[ ### "Yeah I would describe these as solely art or even design ideas? I’m not at all trying convey information or a message other than 'isn’t it sick what you can do in ggplot?' And maybe 'radial type objects are delightful'" <br> .right[— Me when asked why am I even doing this project] ] ] --- class: inverse-spokes, right, bottom .pull-right[ .my-white[ # SPOKES ] ] --- .pull-left[ ```r lines = tibble( x = seq(0, 19, by = .5), xend = x, y = c(rep(c(5, 10), 19), 5), yend = rep(0, 39), speed = 3) dots = lines %>% select(x, y) ggplot() + geom_segment(data = lines, aes(x = x, y = y, xend = xend, yend = yend), color = "white") + geom_point(data = dots, aes(x = x, y = y), color = "white") + scale_x_continuous(limits = c(0, 19)) + scale_y_continuous(limits = c(-5, 10)) + coord_polar() + labs(caption = "Ijeamaka Anyene | @ijeamaka_a") + apply_pattern_theme(bg_hex = "#75926f", caption_hex = "white") ``` ] .pull-right[ 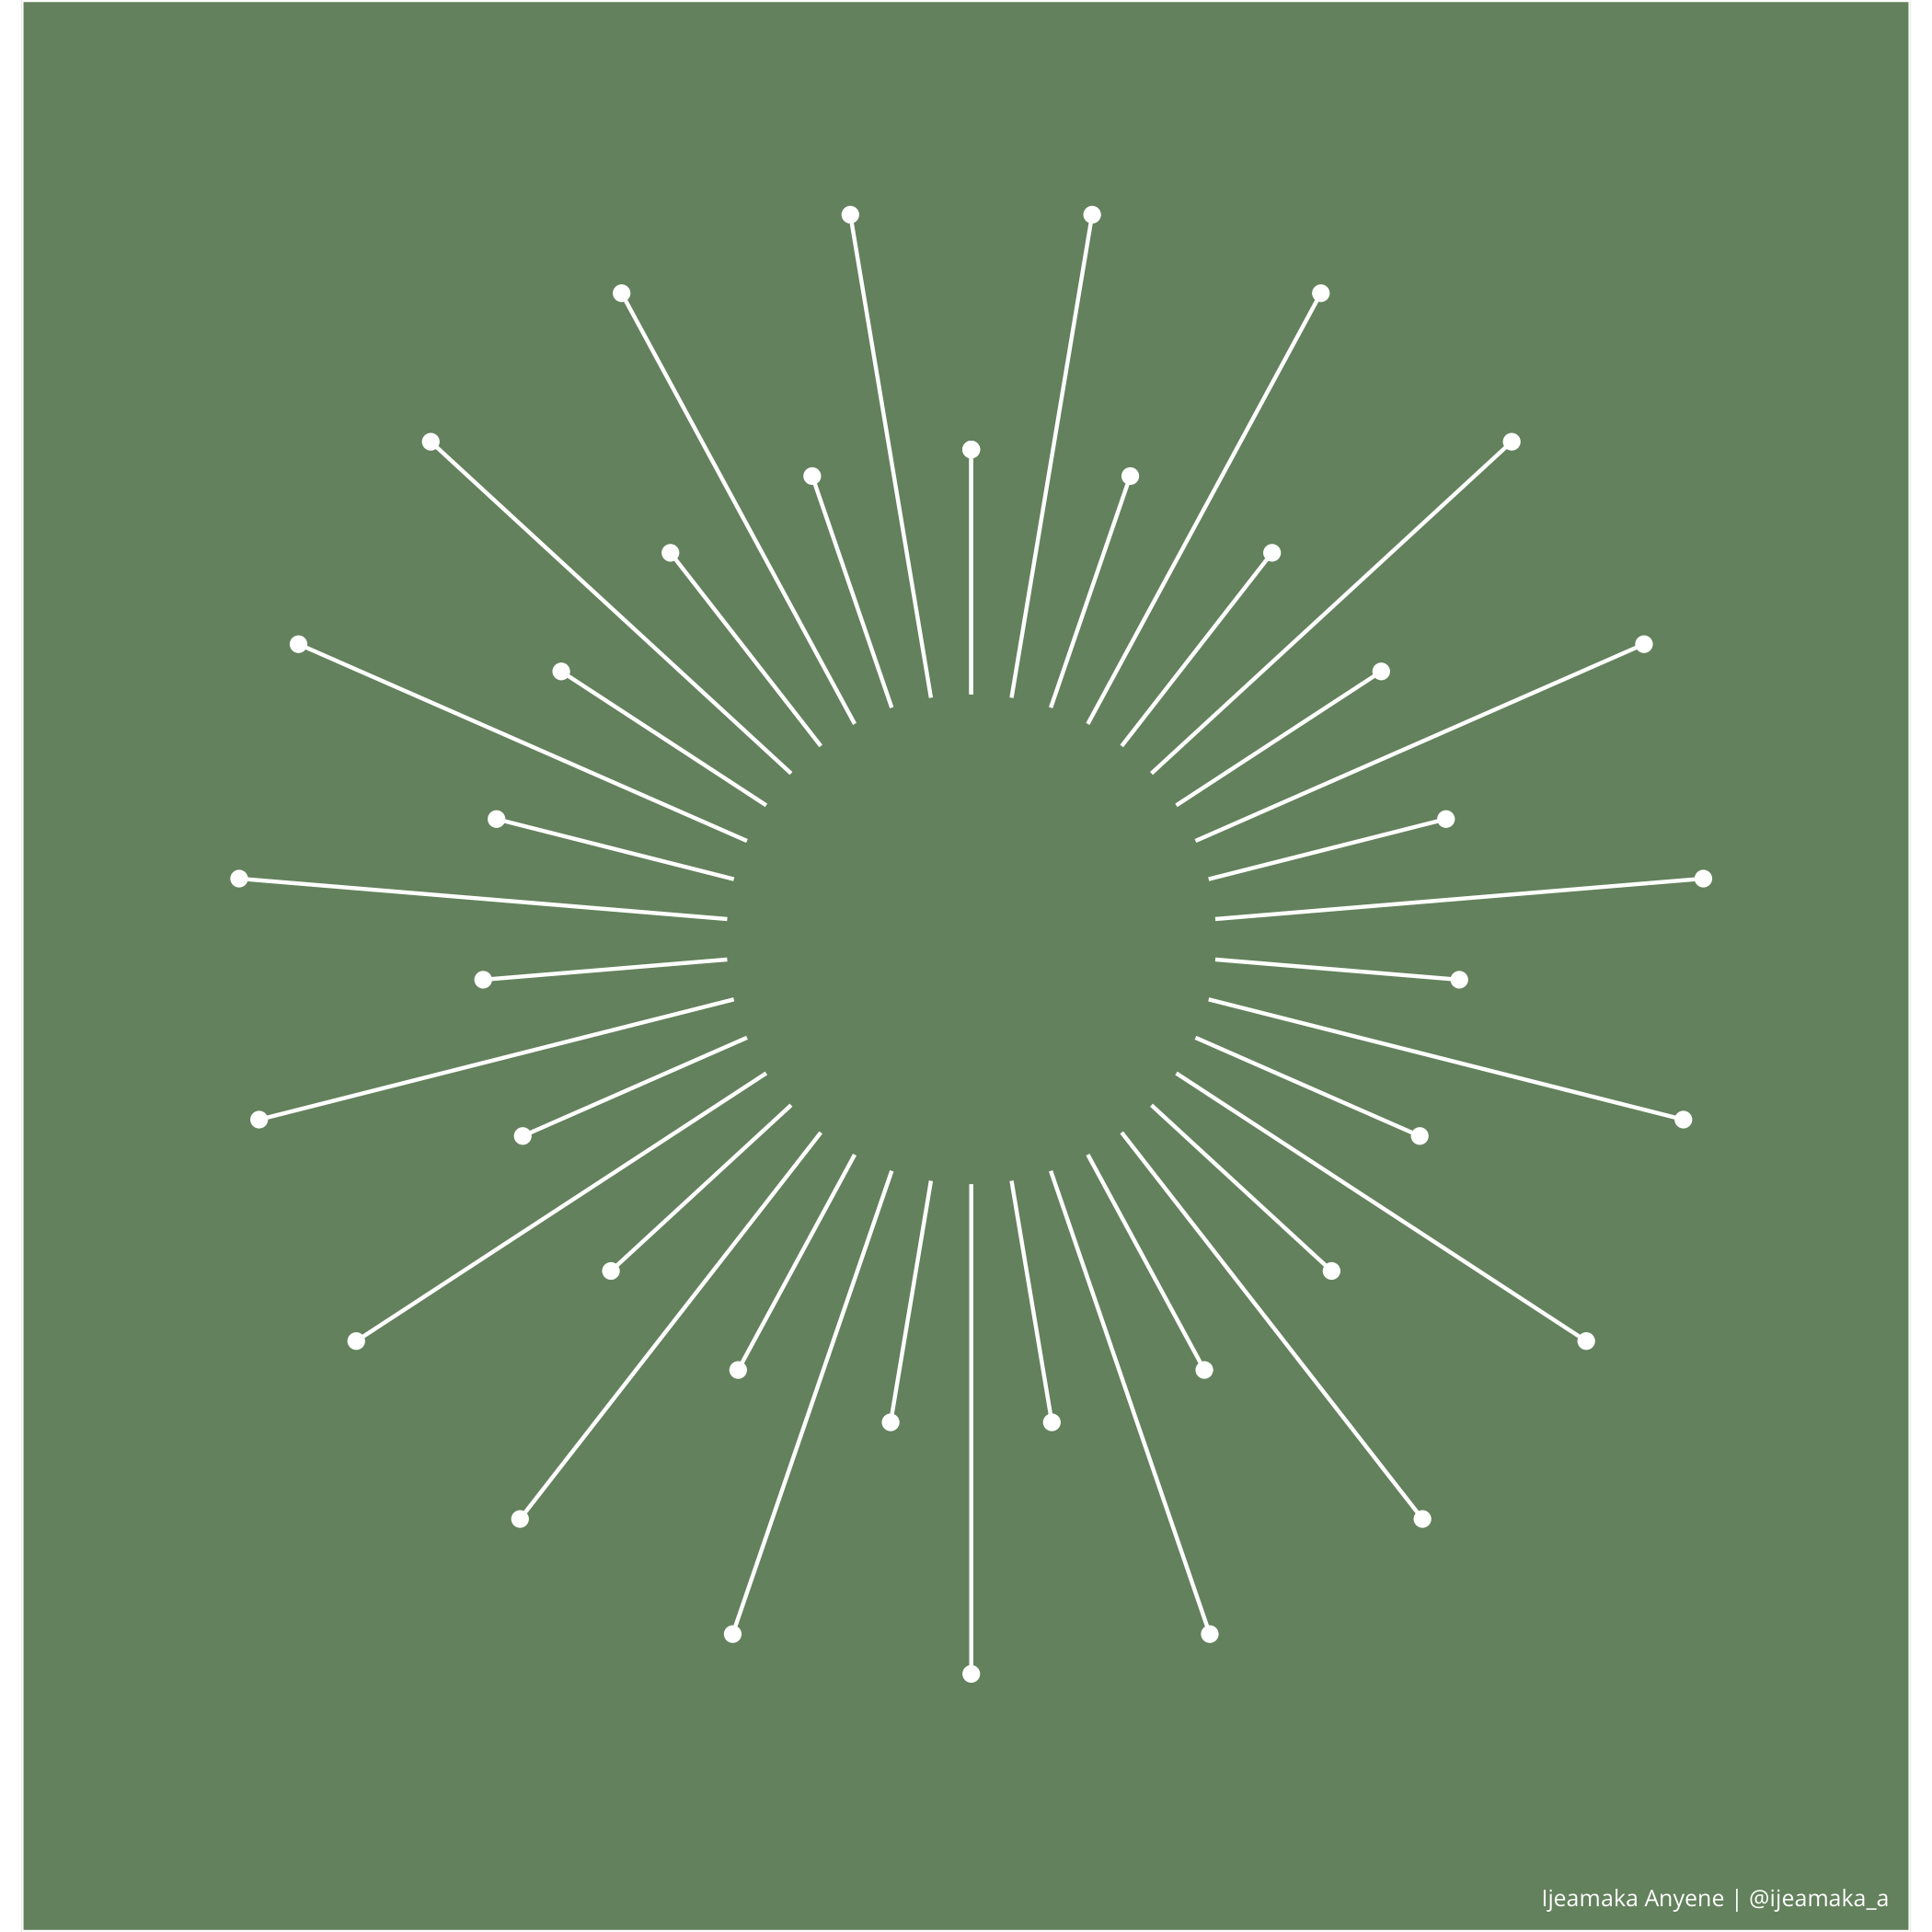 ] .footer-spokes[**SPOKES: PATTERN 01**] --- .pull-left[ ```r center_circle = tibble( x = seq(0, 19, by = .5), xend = x, y = rep(0, 39), yend = rep(3, 39)) outer_circle = center_circle %>% mutate(y = yend, yend = yend + 6) ggplot() + geom_segment(data = center_circle, aes(x = x, xend = xend, y = y, yend = yend), size = 0.5, color = "white") + geom_segment(data = outer_circle, aes(x = x, xend = xend, y = y, yend = yend), size = 2, color = "white") + scale_y_continuous(limits = c(-2, 10)) + coord_polar() + labs(caption = "Ijeamaka Anyene | @ijeamaka_a") + apply_pattern_theme(bg_hex = "#8a484a", caption_hex = "white") ``` ] .pull-right[ 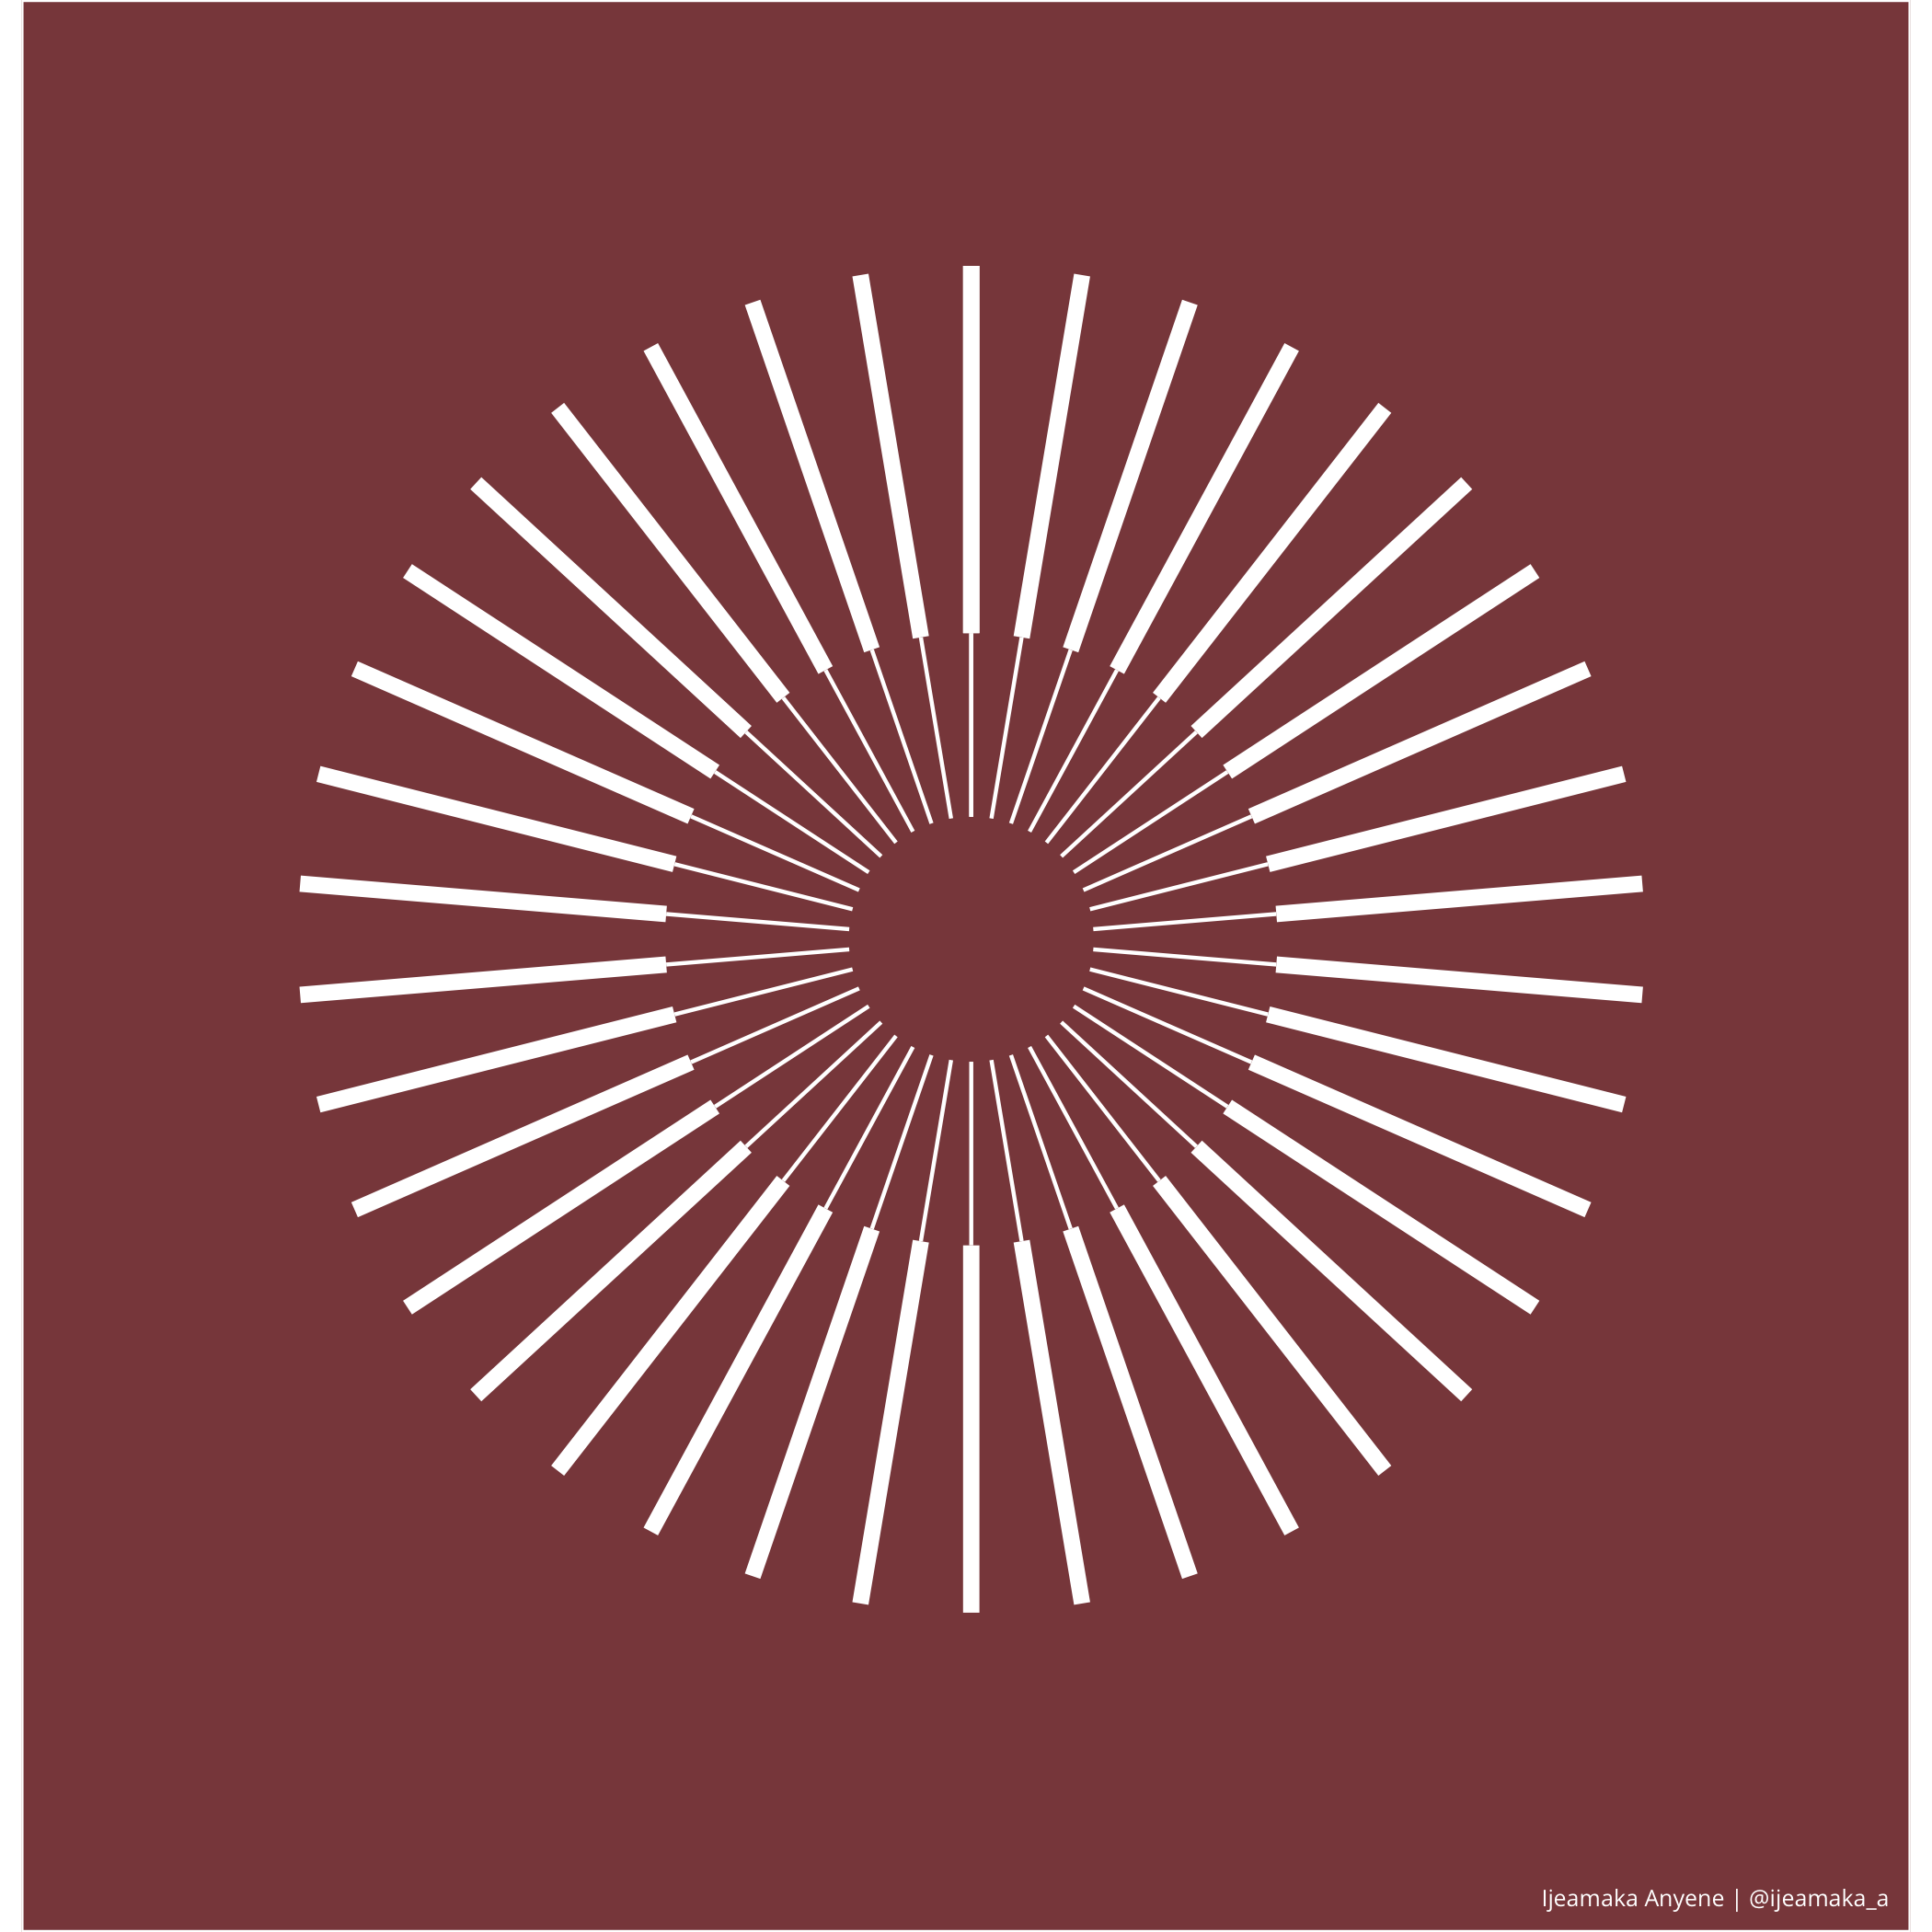 ] .footer-spokes[**SPOKES: PATTERN 03**] --- .pull-left[ ```r increment = .05 circle_1 = tibble( x = seq(from = 0, to = 5, by = increment), xend = seq(from = 0, to = 5, by = increment), y = 0, yend = 1.5, type = LETTERS[1]) circle_2 = tibble( x = seq(from = 0, to = 5, by = increment), xend = seq(from = 0, to = 5, by = increment), y = 1.5, yend = 3, type = LETTERS[2]) circle_3 = tibble( x = seq(from = 0, to = 5, by = increment), xend = seq(from = 0, to = 5, by = increment), y = 3, yend = 4.5, type = LETTERS[3]) palette_values = c("#ba6763", "#8d667e", "#39355c") bind_rows(circle_1, circle_2, circle_3) %>% ggplot(.) + geom_segment(aes(x = x, y = y, xend = xend, yend = yend, color = type)) + scale_color_manual(values = palette_values) + labs(caption = "Ijeamaka Anyene | @ijeamaka_a") + coord_polar() + apply_pattern_theme(bg_hex = "#fffcef", caption_hex = "black") ``` ] .pull-right[ 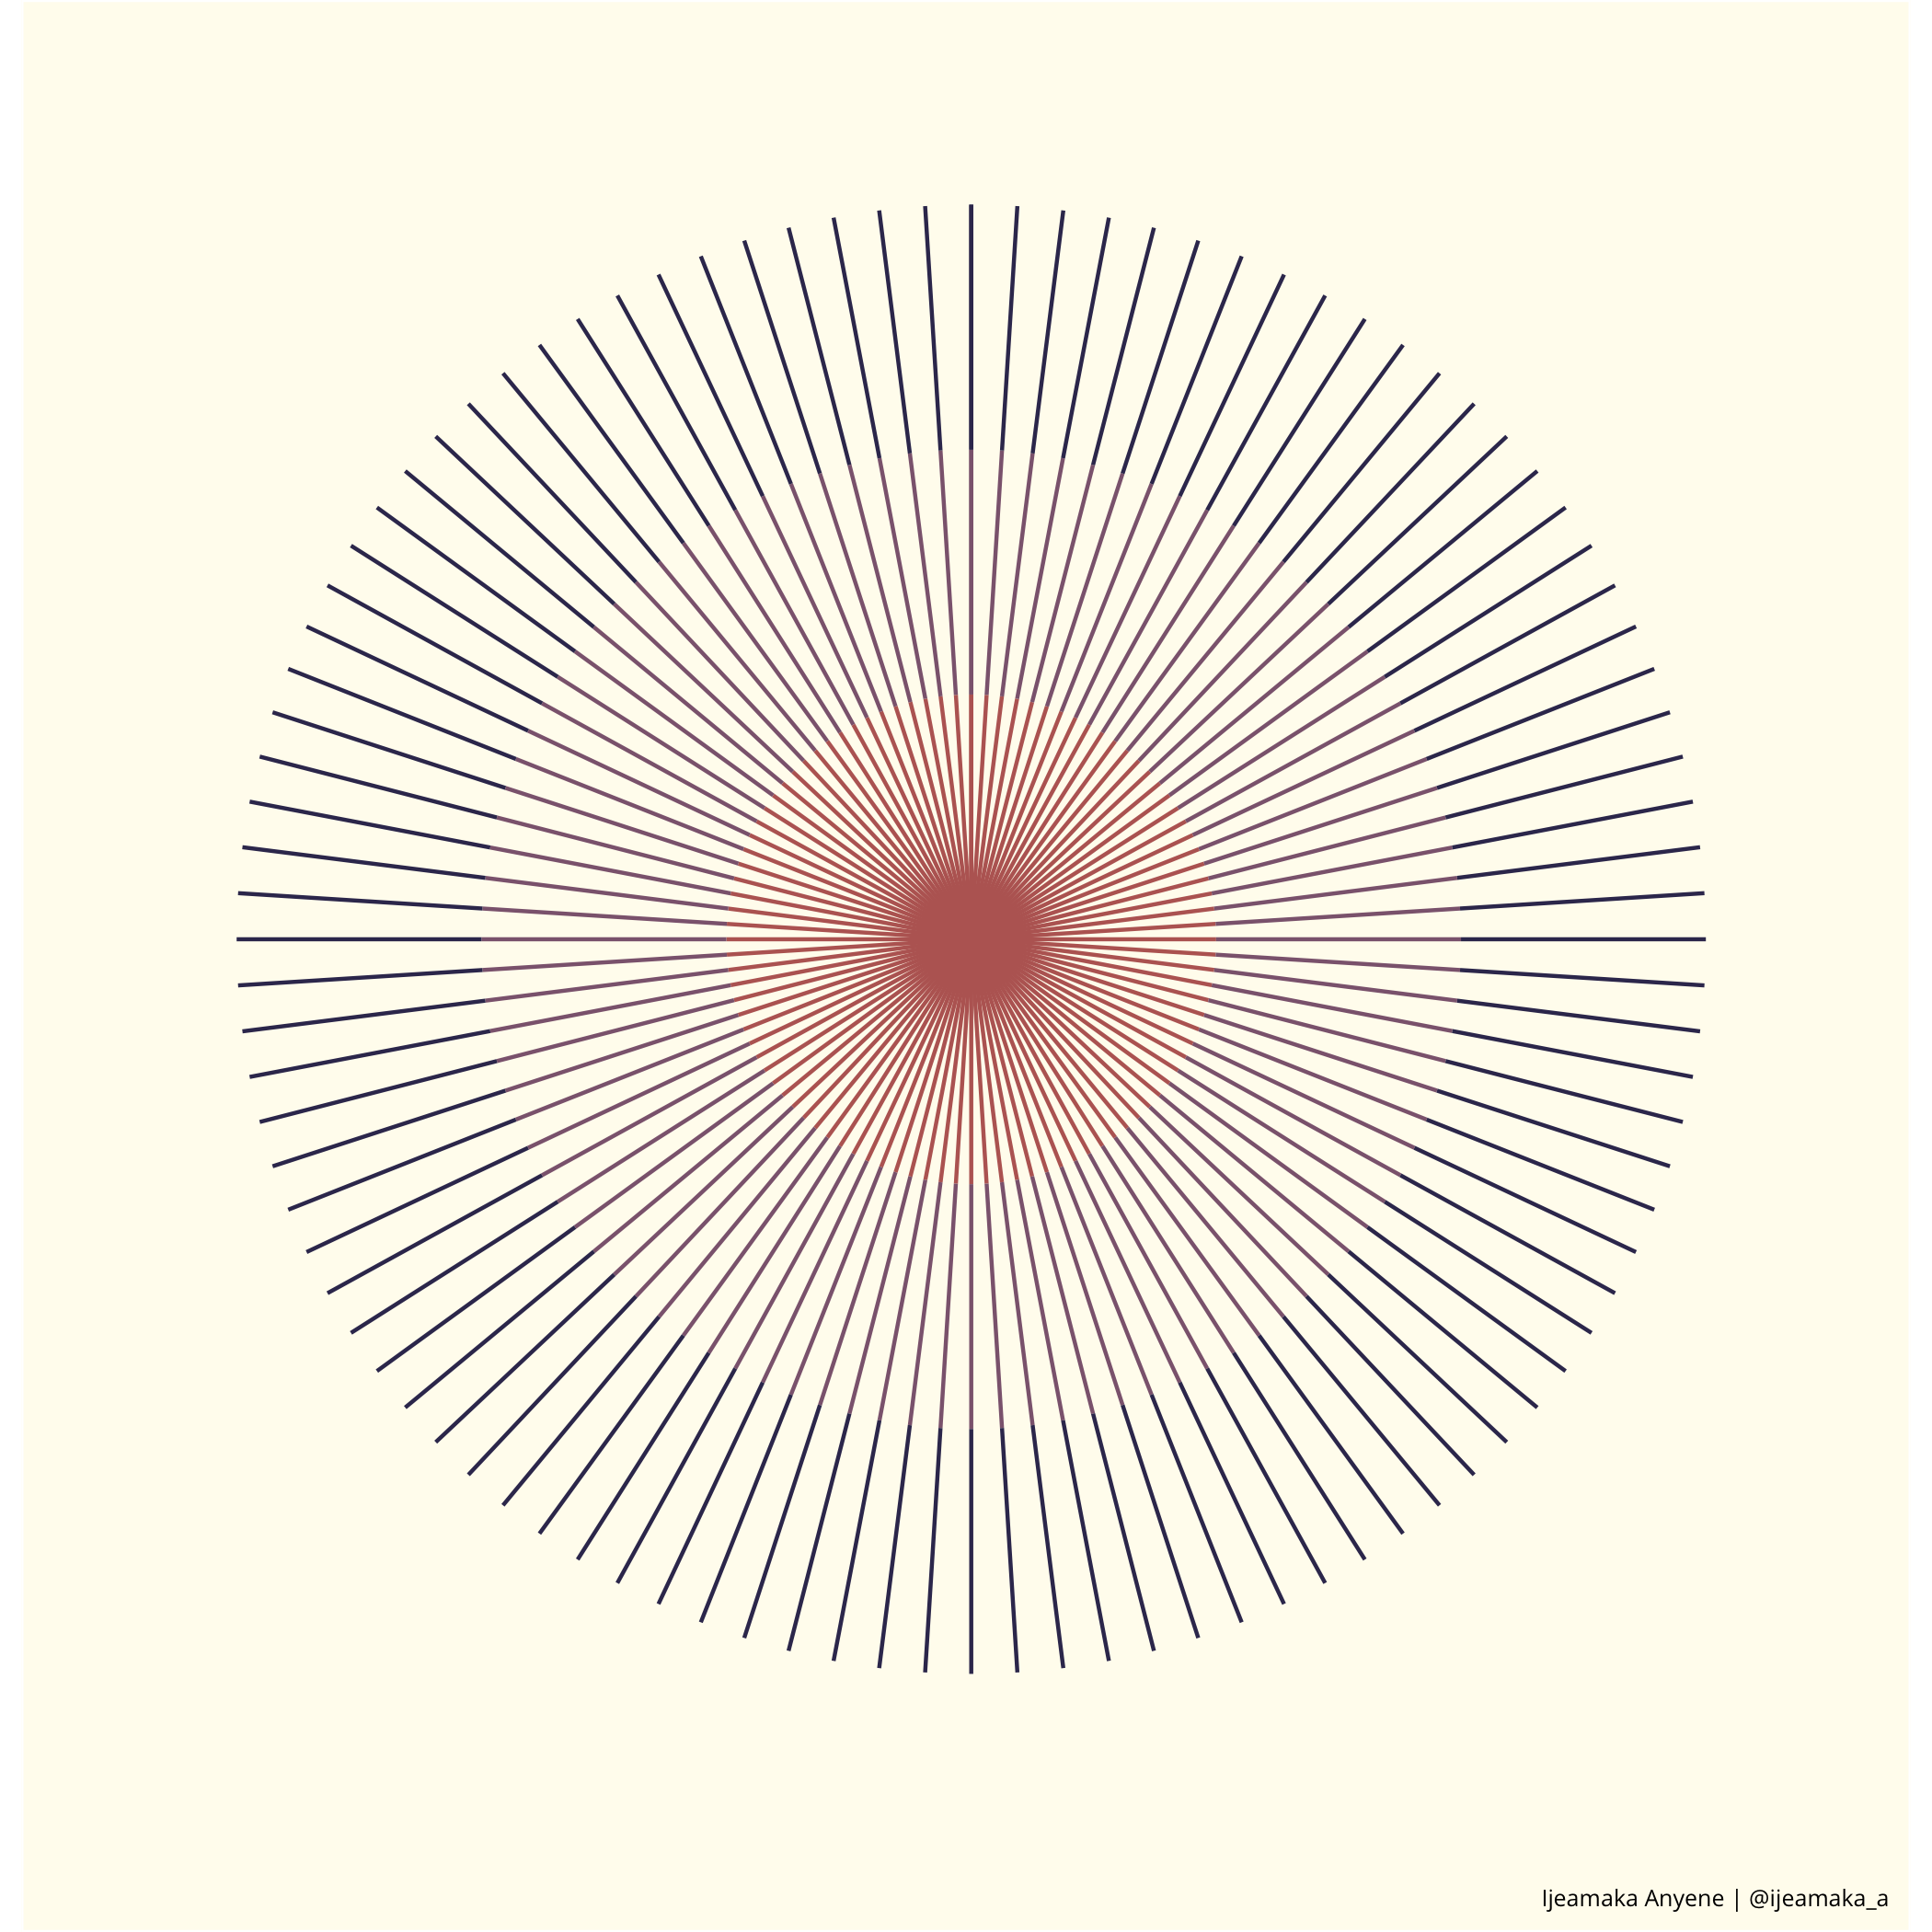 ] .footer-spokes[**SPOKES: PATTERN 10**] --- .pull-left[ ```r num_lines = 80 lines = tibble( x = 1:num_lines, xend = x, y = 1, yend = 10) overlap_lines = tibble( x = 1:80, xend = x, y = rep(seq(1, 10, length.out = 20), 4), yend = rep(seq(10, 1, length.out = 20), 4)) ggplot() + geom_segment(data = lines, aes(x = x, xend = xend, y = y, yend = yend), color = "#743c52") + geom_segment(data = overlap_lines, aes(x = x, xend = xend, y = y, yend = yend), color = "white") + coord_polar() + labs(caption = "Ijeamaka Anyene | @ijeamaka_a") + scale_y_continuous(limits = c(-2, 10)) + scale_x_continuous(limits = c(1, num_lines)) + apply_pattern_theme(bg_hex = "#1e2539", caption_hex = "black") ``` ] .pull-right[ 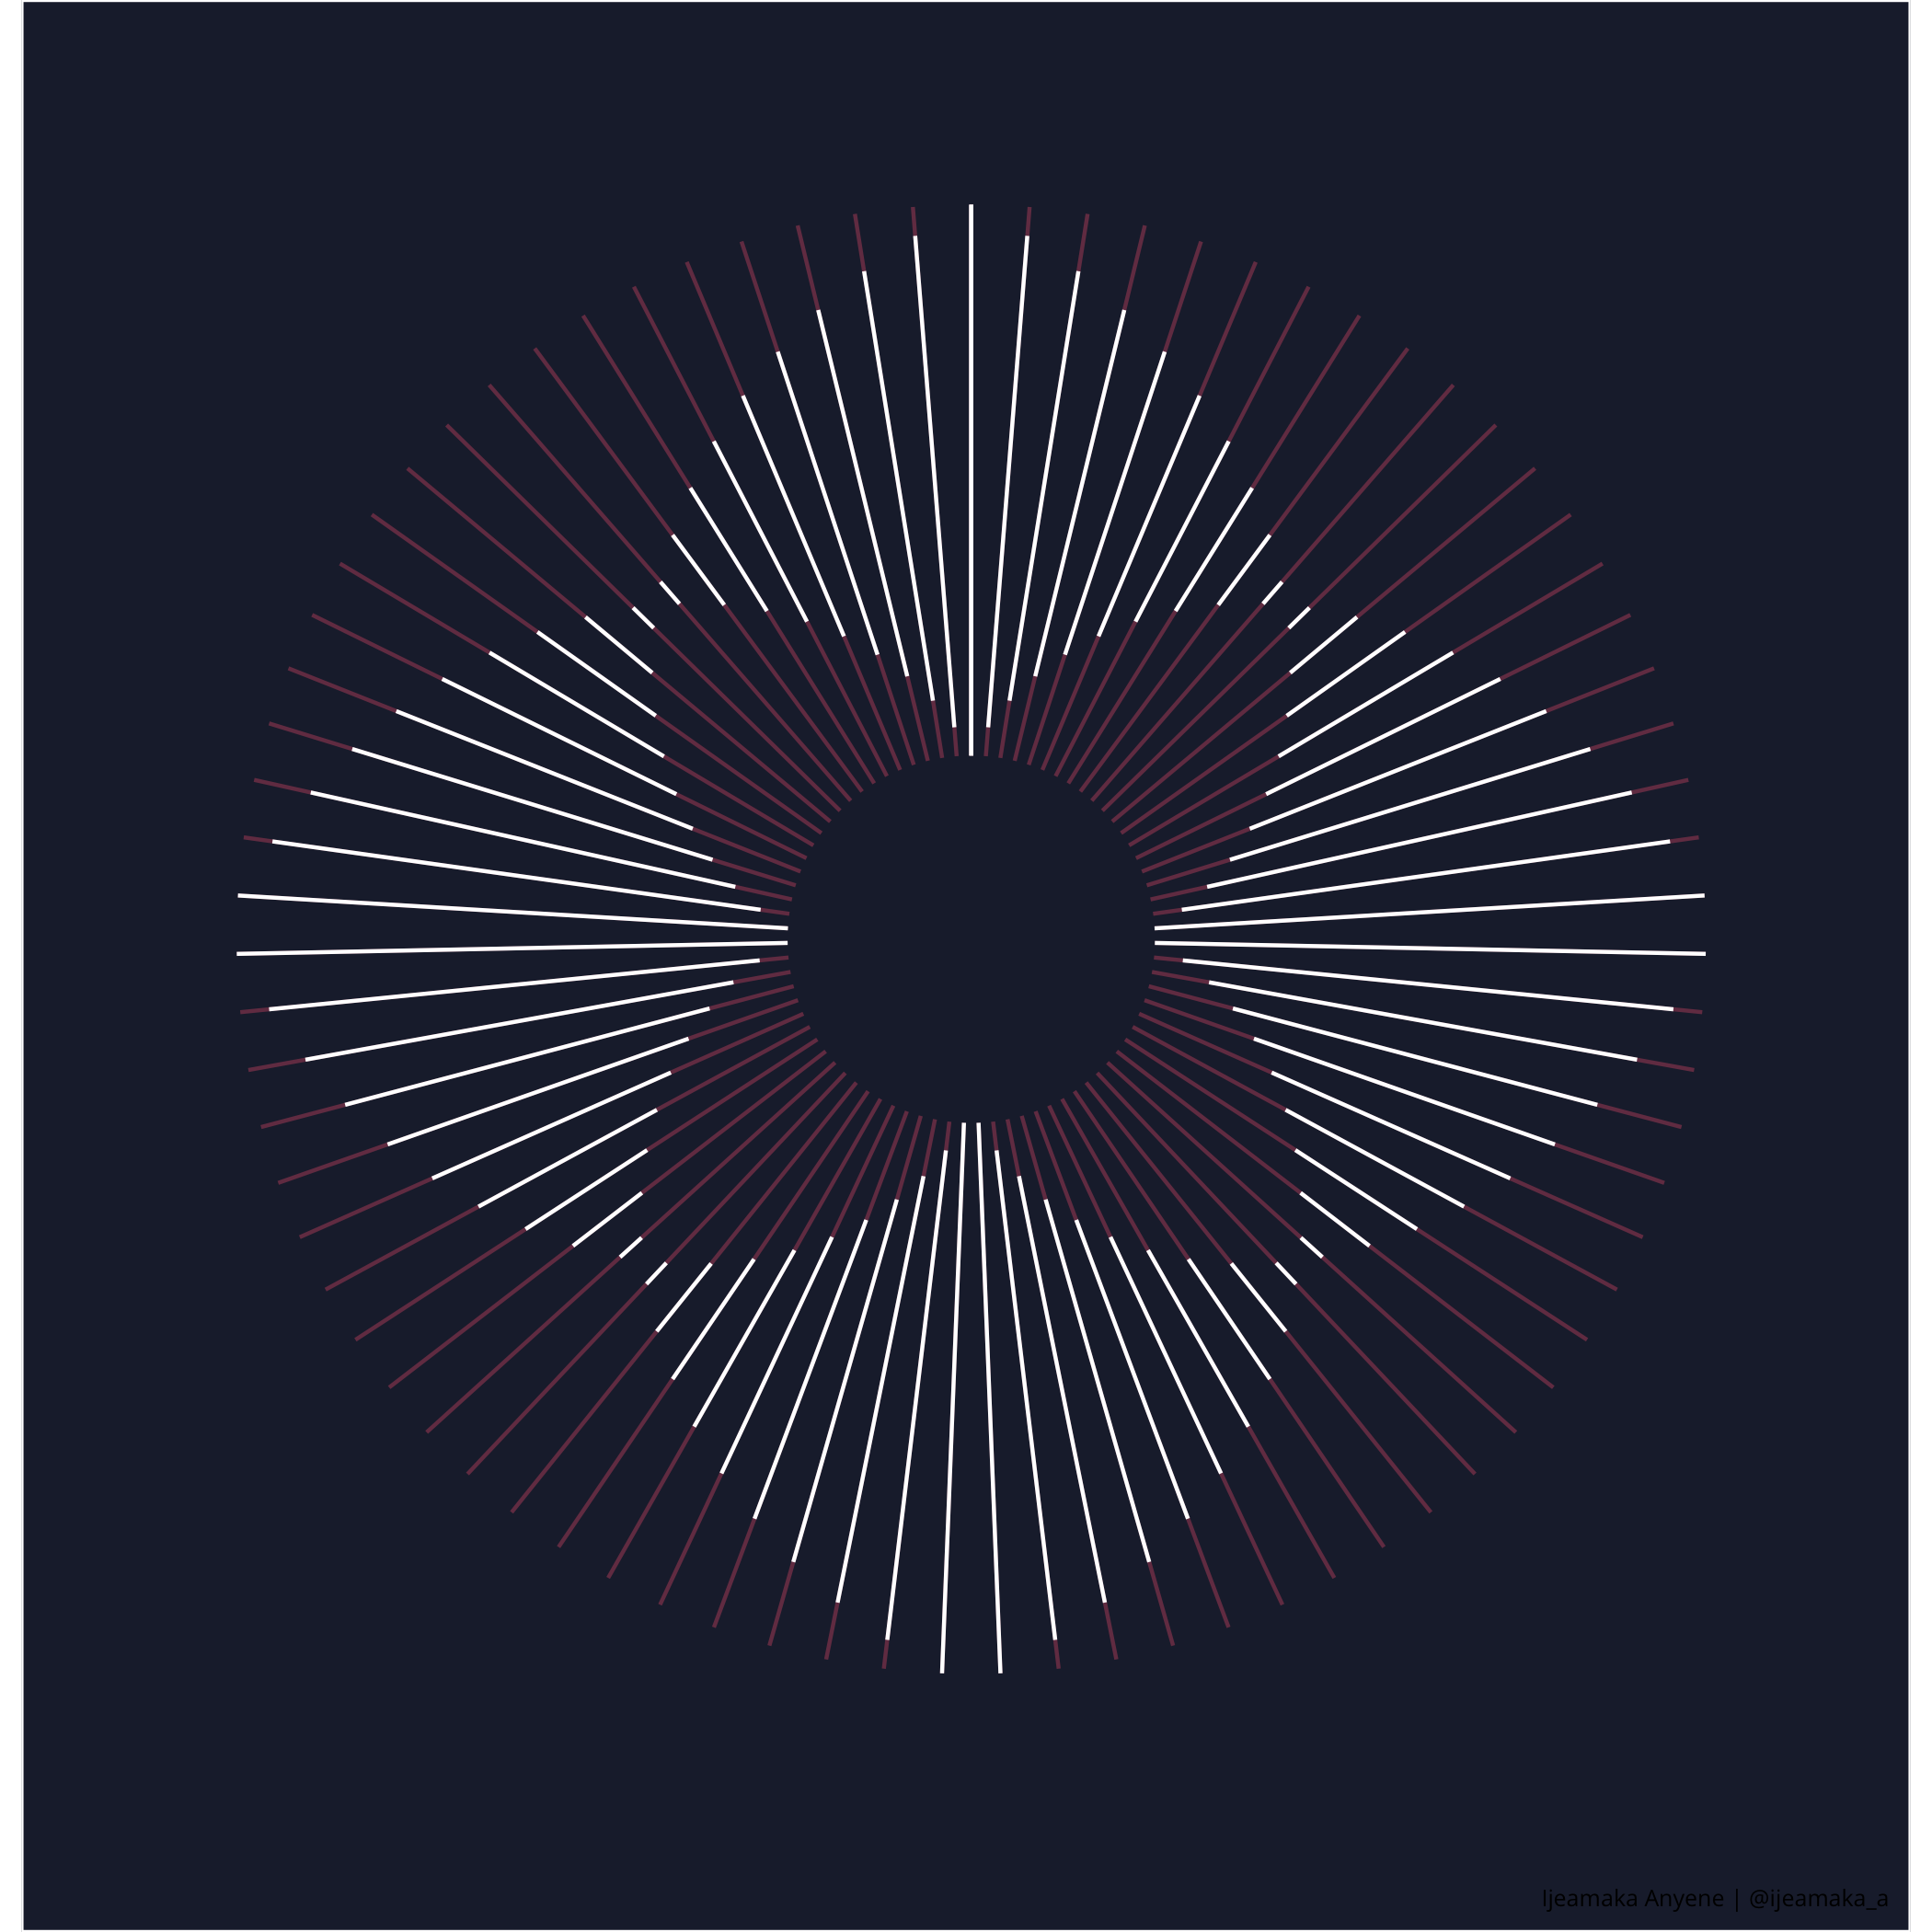 ] .footer-spokes[**SPOKES: PATTERN 15**] --- class: inverse-spokes, left, middle .pull-right[ .my-white[ ### For most of my plots, choosing a color palette took longer than creating the graphic. Using color-hex.com helps with this issue. ### <br><br>I would think of what ~vibes~ the graphic gave off, then literally searched that word. Some words used: space, magic, vibrant, earth, rust, plants, etc. ] ] --- .pull-left[ ```r num_lines = 80 lines = tibble( x = 1:num_lines, xend = x, y = 1, yend = 10) overlap_lines = tibble( x = 40:80, xend = x, y = c(seq(1, 10, length.out = 20), seq(10, 1, length.out = 21)), yend = 1) ggplot() + geom_segment(data = lines, aes(x = x, xend = xend, y = y, yend = yend), color = "white") + geom_segment(data = overlap_lines, aes(x = x, xend = xend, y = y, yend = yend), color = "#f29544") + labs(caption = "Ijeamaka Anyene | @ijeamaka_a") + scale_y_continuous(limits = c(-2, 10)) + coord_polar() + apply_pattern_theme(bg_hex = "#005555", caption_hex = "white") ``` ] .pull-right[ 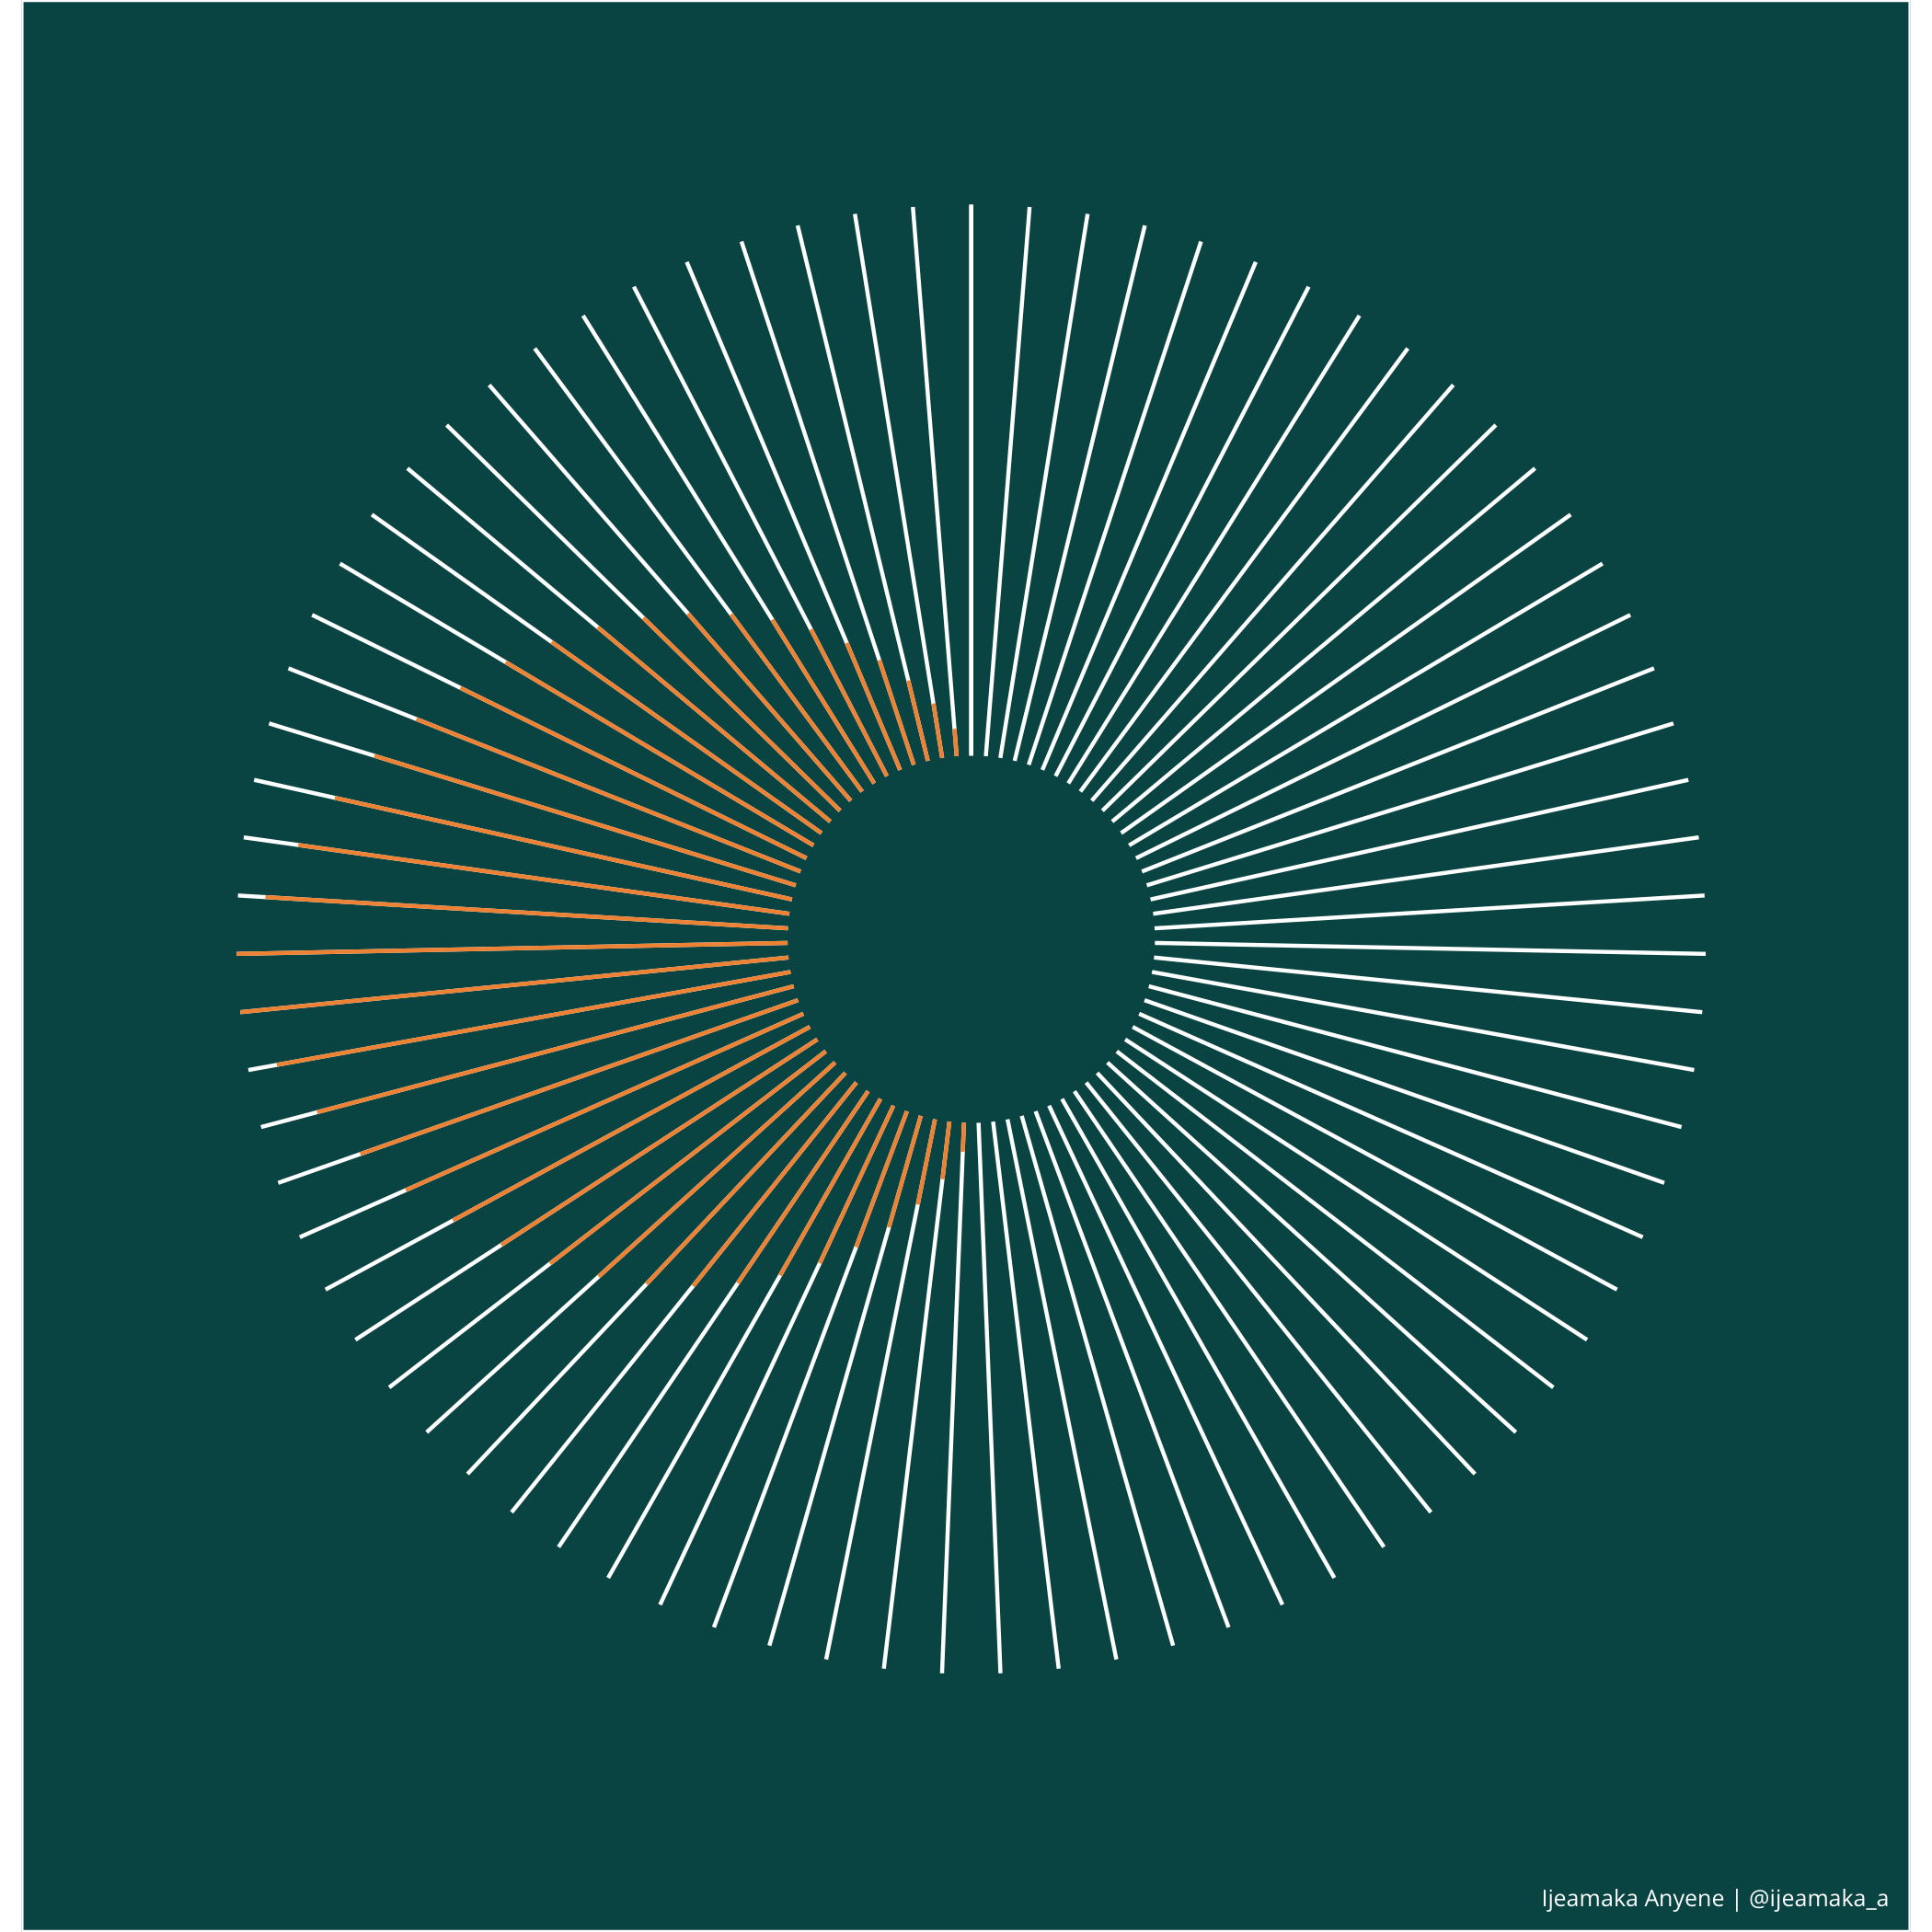 ] .footer-spokes[**SPOKES: PATTERN 16**] --- .pull-left[ ```r num_lines = 80 lines = tibble( x = 1:num_lines, xend = x, y = 1, yend = 10) overlap_lines = tibble( x = 40:80, xend = x, y = 5, yend = 1) ggplot() + geom_segment(data = lines, aes(x = x, xend = xend, y = y, yend = yend)) + geom_segment(data = overlap_lines, aes(x = x, xend = xend, y = y, yend = yend), color = "white", size = .7) + coord_polar() + labs(caption = "Ijeamaka Anyene | @ijeamaka_a") + apply_pattern_theme(bg_hex = "#ededed", caption_hex = "black") ``` ] .pull-right[ 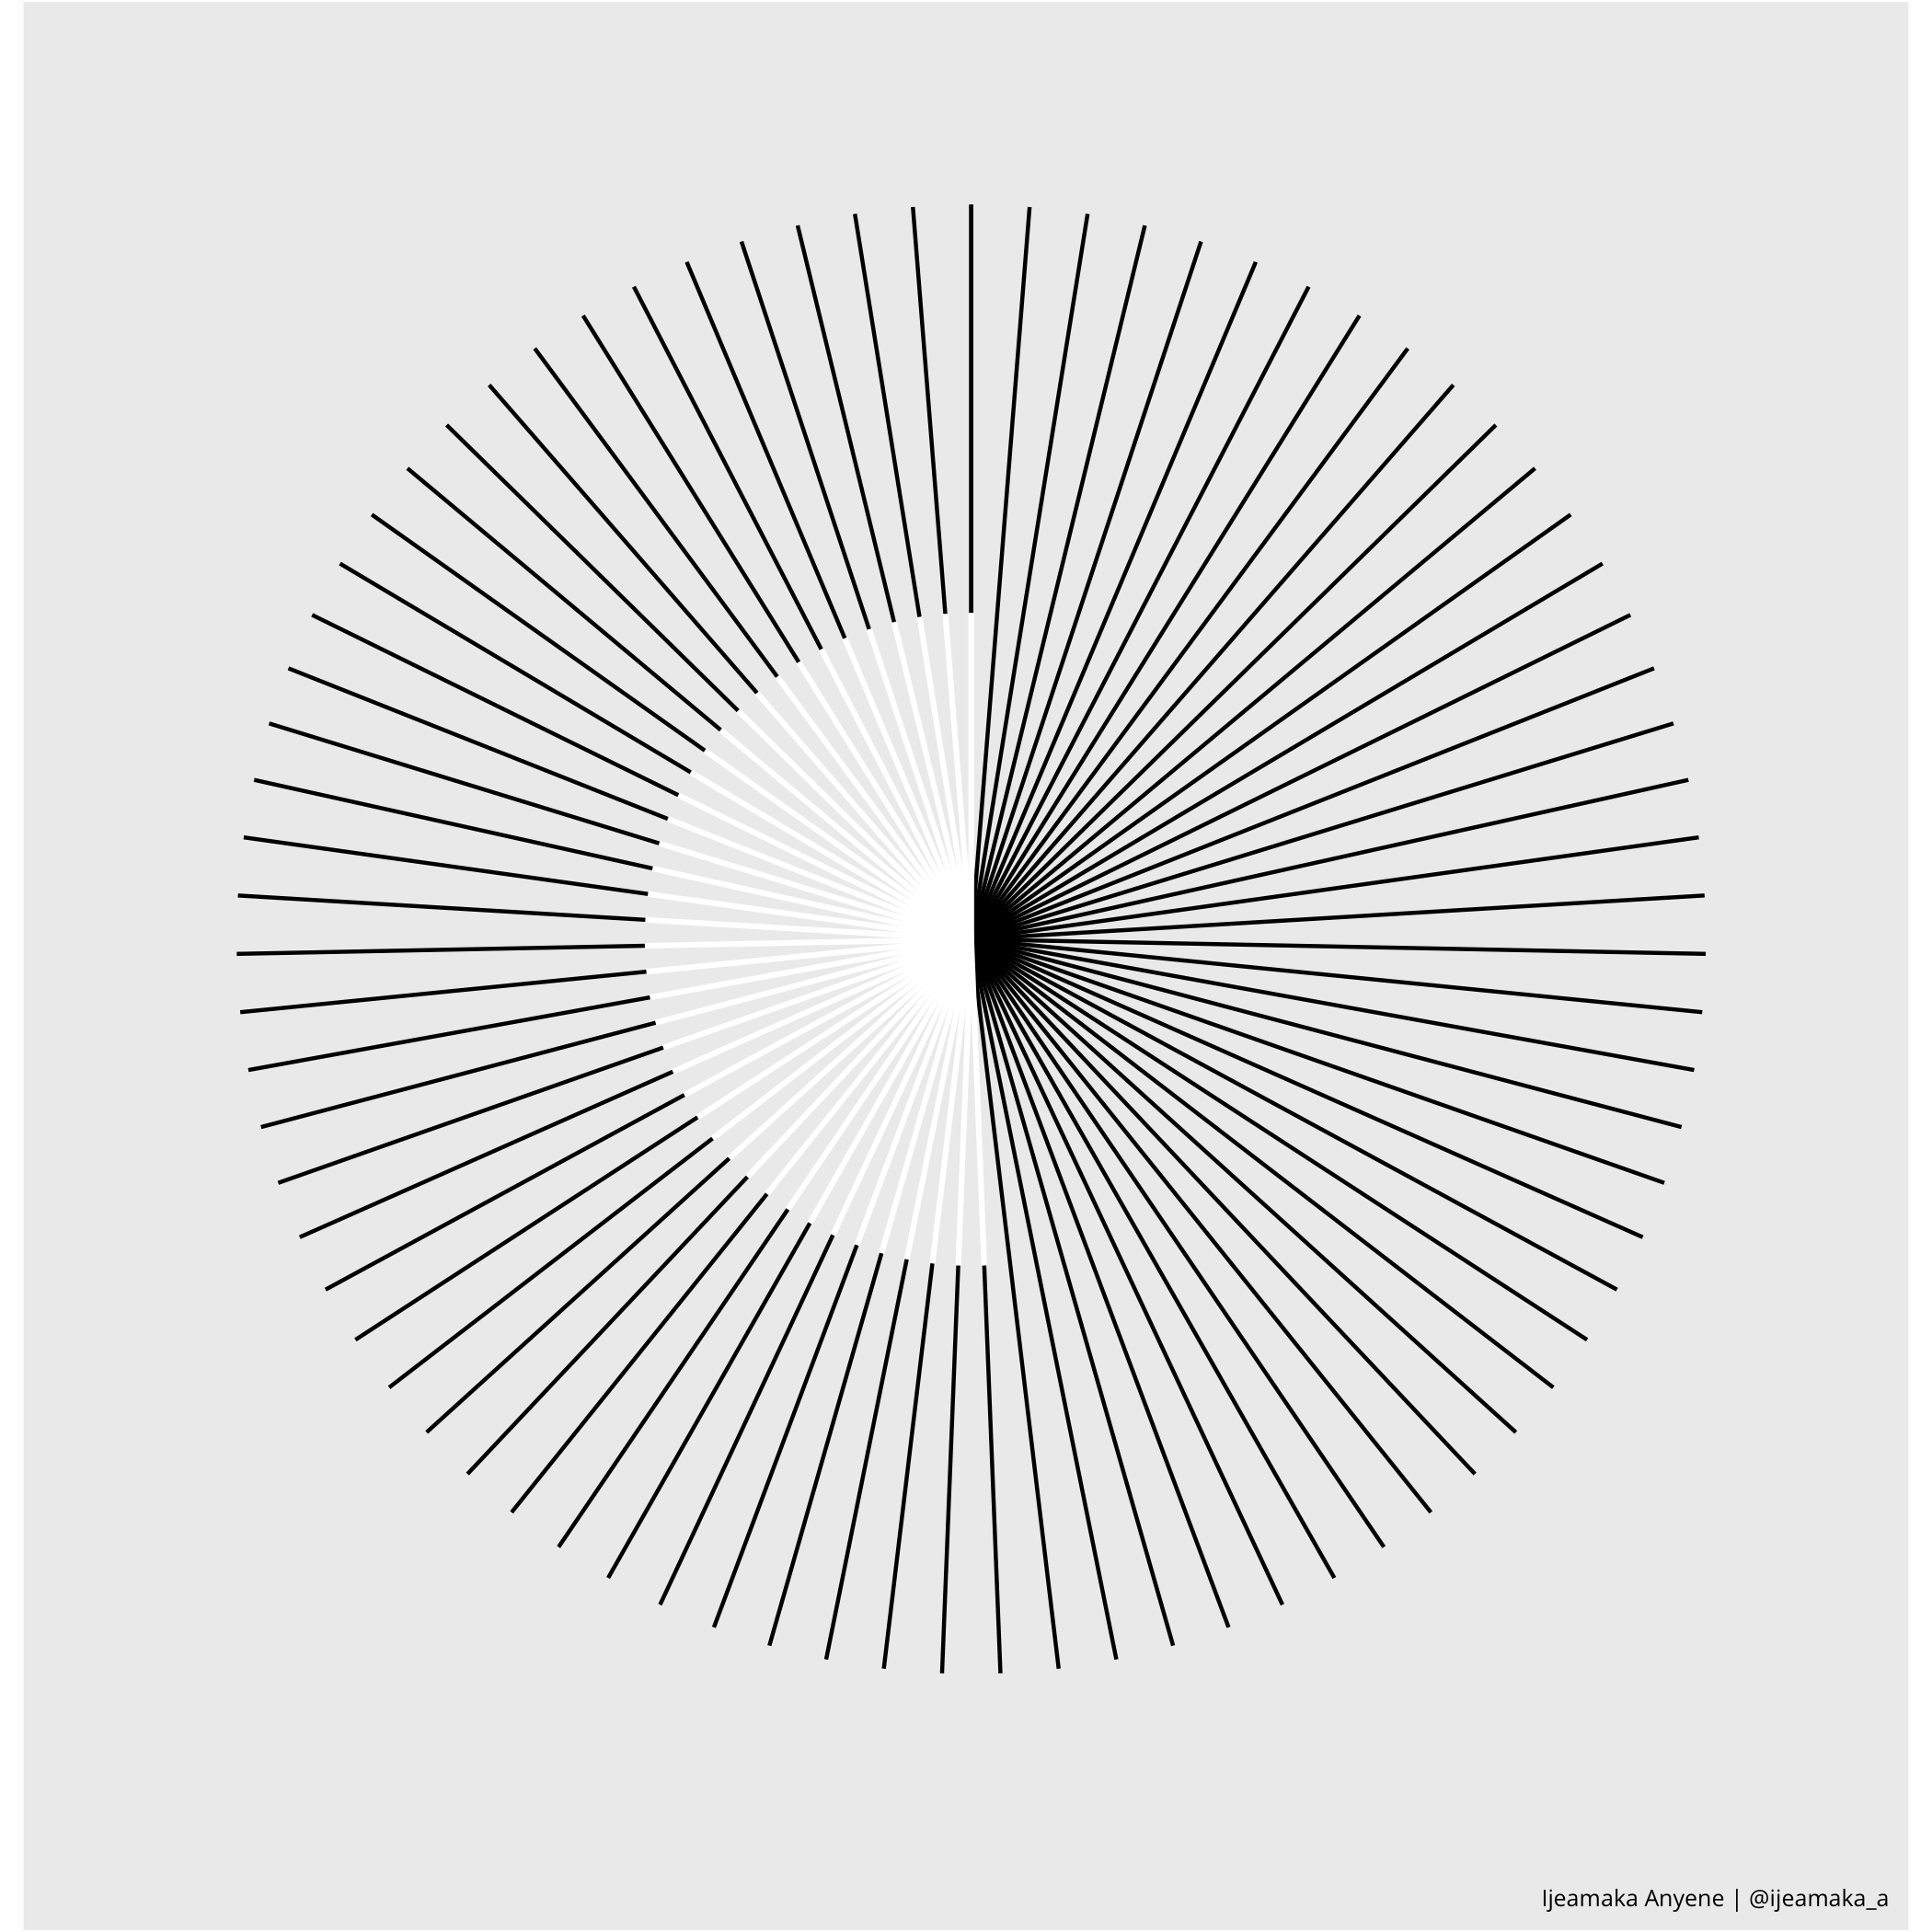 ] .footer-spokes[**SPOKES: PATTERN 17**] --- .pull-left[ ```r num_lines = 40 lines = tibble( x = seq(1, to = num_lines, by = 1), xend = x, y = 1, yend = 2) add_lines = function(in_df, x_shift){ x = in_df$x + x_shift xend = x y = (in_df$y + in_df$yend) / 2 yend = y + 2 out_df = tibble(x, xend, y, yend) return(out_df) } lines_2 = add_lines(lines, .5) lines_3 = add_lines(lines_2, -.5) lines_4 = add_lines(lines_3, .5) lines_5 = add_lines(lines_4, -.5) lines_6 = add_lines(lines_5, .5) bind_rows(lines, lines_2, lines_3, lines_4, lines_5, lines_6) %>% ggplot() + geom_segment(aes(x = x, y = y, xend = xend, yend = yend), color = "#fbca03", size = 1) + geom_segment(aes(x = x, y = y, xend = xend, yend = yend), color = "#fbca03", alpha = 0.5, size = 2) + scale_y_continuous(limits = c(-1, 10)) + scale_x_continuous(limits = c(1, 40)) + coord_polar() + labs(caption = "Ijeamaka Anyene | @ijeamaka_a") + apply_pattern_theme(bg_hex = "black", caption_hex = "white") ``` ``` ## Warning: Removed 3 rows containing missing values (geom_segment). ## Warning: Removed 3 rows containing missing values (geom_segment). ``` ] .pull-right[ 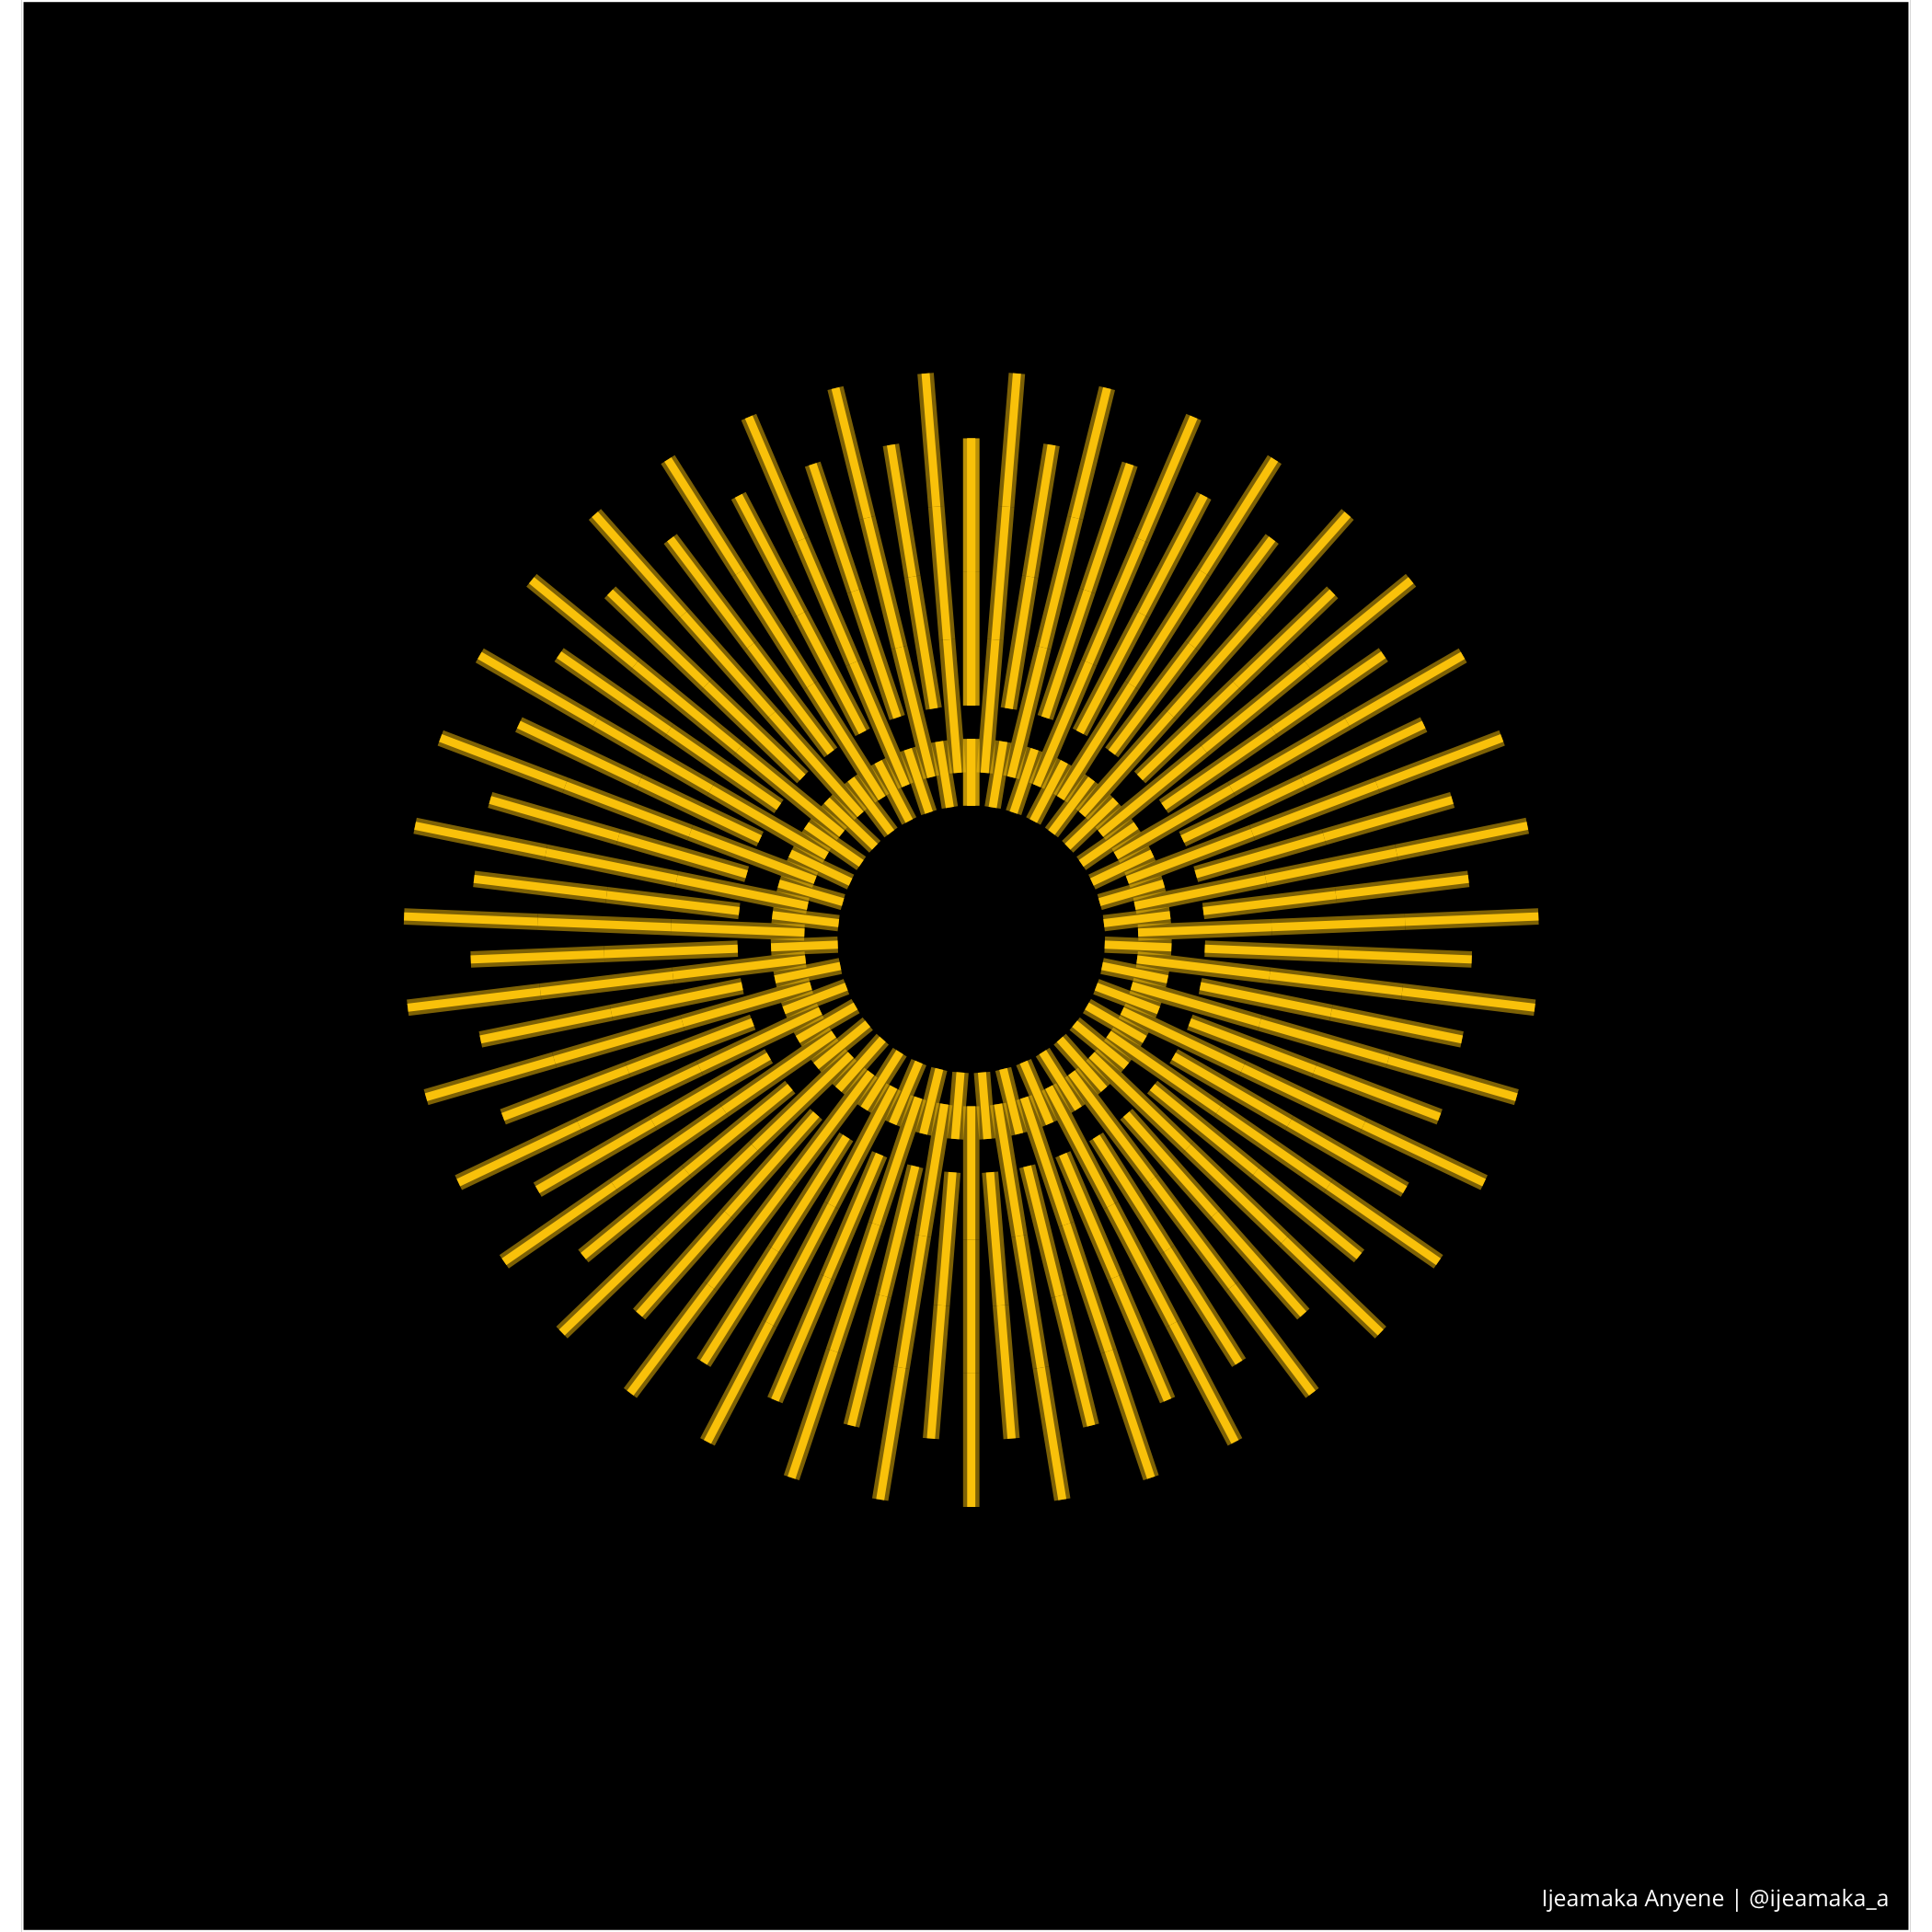 ] .footer-spokes[**SPOKES: PATTERN 18**] --- .pull-left[ ```r cols = tibble( x = 1, y = 6:1, type = LETTERS[1:6]) lines_mid = tibble( x = seq(-.5, 2.5, by = .1), xend = x, y = 6, yend = 10) lines_bottom = lines_mid %>% mutate(y = 1, yend = 3) lines_top = lines_mid %>% mutate(y = 15, yend = 21) palette_color = c("#1b1626", "#2a2640", "#734656", "#a64e46", "#f27d52", "#f29544") ggplot() + geom_col(data = cols, aes(x = x, y = y, fill = type, color = type), width = 3) + geom_segment(data = lines_mid, aes(x = x, y = y, xend = xend, yend = yend), size = 1.5, color = "#a64e46") + geom_segment(data = lines_bottom, aes(x = x, y = y, xend = xend, yend = yend), color = "#f29544") + geom_segment(data = lines_top, aes(x = x, y = y, xend = xend, yend = yend), size = 3, color = "#2a2640") + scale_fill_manual(values = palette_color) + scale_color_manual(values = palette_color) + labs(caption = "Ijeamaka Anyene | @ijeamaka_a") + coord_polar() + apply_pattern_theme("#c0b8b5", "black") ``` ] .pull-right[ 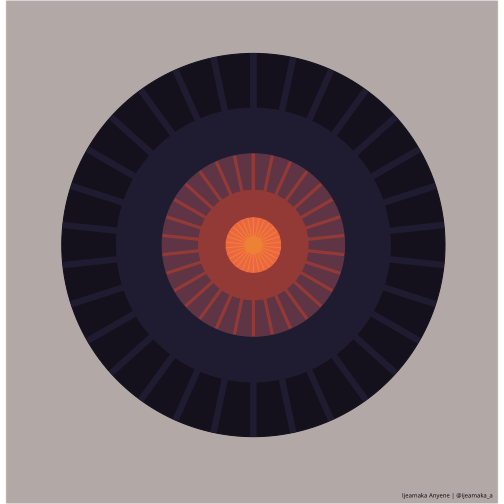 ] .footer-spokes[**SPOKES: PATTERN 28**] --- class: inverse-paths, right, bottom .pull-right[ .my-white[ # PATHS ] ] --- .pull-left[ ```r num_lines = 10 circle = tibble( x = rep(0, 10, length.out = num_lines), xend = seq(from = 5, to = 10, length.out = num_lines), y = 1:num_lines, yend = 1:num_lines) ggplot(data = circle) + geom_segment(aes(x = x, y = y, xend = xend, yend = yend), color = "white") + scale_x_continuous(limits = c(0, 12)) + scale_y_continuous(limits = c(-3, num_lines)) + coord_polar() + labs(caption = "Ijeamaka Anyene | @ijeamaka_a") + apply_pattern_theme(bg_hex = "#14232a", caption_hex = "white") ``` ] .pull-right[  ] .footer-paths[**PATHS: PATTERN 02**] --- class: inverse-paths, left, middle .pull-left[ # .my-black[pattern 02 <br>deep dive] ] .pull-right[ .my-white[ ###coord_polar() displays your data clockwise. If you want to create a counterclockwise visualization, you need to think about your x-axis as two halves. ###The leftmost to the midpoint side of the x-axis in the cartesian plane is the rightmost side in the polar. Then the rightmost side of the x-axis in the cartesian plane, but the leftmost side in the polar. ] ] --- .pull-left[ ```r num_lines = 20 thin_lines = tibble( y = 1:num_lines, yend = 1:num_lines, x = 0, xend = num_lines) set.seed(100) thick_lines = tibble( y = c(1:num_lines, 1:num_lines), yend = c(1:num_lines, 1:num_lines), x = runif(num_lines*2, min = 0, max = 15), xend = x + runif(num_lines*2, min = 1, max = 5) ) ggplot() + geom_segment(data = thin_lines, aes(x = x, y = y, xend = xend, yend = yend), color = "#aaaaaa", size = 0.5) + geom_segment(data = thick_lines, aes(x = x, y = y, xend = xend, yend = yend), color = "#0c0507", size = 1.5, lineend = "round") + scale_x_continuous(limits = c(0, 20)) + labs(caption = "Ijeamaka Anyene | @ijeamaka_a") + coord_polar() + apply_pattern_theme(bg_hex = "white", caption_hex = "black") ``` ] .pull-right[ <img src="../outputs/pattern_8.png" width="100%" style="display: block; margin: auto;" /> ] .footer-paths[**PATHS: PATTERN 08**] --- .pull-left[ ```r rings = tibble( x = 1, xend = 5, y = c(2, 5), yend = c(2, 5)) points = tibble( x = c(2, 4, 1.5, 3.5), y = c(2, 2, 5, 5)) ggplot() + geom_segment(data = rings, aes(x = x, xend = xend, y = y, yend = yend), color = "white") + geom_point(aes(x = 3, y = 0), size = 4, color = "#c74a00") + geom_point(data = points, aes(x = x, y = y), size = 3, color = "#f39200") + scale_y_continuous(limits = c(0, 5)) + coord_polar() + labs(caption = "Ijeamaka Anyene | @ijeamaka_a") + apply_pattern_theme(bg_hex = "#2e2137", caption_hex = "white") ``` ] .pull-right[  ] .footer-paths[**PATHS: PATTERN 11**] --- .pull-left[ ```r ggplot() + geom_abline(intercept = seq(-0.8, 0.9, by = .05), slope = -1, color = "white") + geom_point(aes(x = 1, y = -1), color = "#1a2656", size = 101) + scale_y_continuous(limits = c(-1, 1), expand = c(0, 0)) + scale_x_continuous(limits = c(-1, 1)) + labs(caption = "Ijeamaka Anyene | @ijeamaka_a") + apply_pattern_theme("#1a2656", "white") ``` ] .pull-right[  ] .footer-paths[**PATHS: PATTERN 26**] --- .pull-left[ ```r num_lines = 20 lines = tibble( x = 1:num_lines, xend = x + (1:num_lines), y = 1:num_lines, yend = y) vertical = tibble( x = seq(2, num_lines*2, by = 2), xend = x, y = 1:num_lines, yend = y + 1) ggplot() + geom_segment(data = lines, aes(x = x, y = y, xend = xend, yend = yend), color = "white", lineend = "round", size = 1) + geom_segment(data = vertical, aes(x = x, y = y, xend = xend, yend = yend), color = "white", lineend = "round", size = 1) + scale_y_continuous(limits = c(-5, 21)) + coord_polar() + labs(caption = "Ijeamaka Anyene | @ijeamaka_a") + apply_pattern_theme("#507992", "white") ``` ] .pull-right[  ] .footer-paths[**PATHS: PATTERN 30**] --- .pull-left[ ```r num_lines = 1000 r_vals = seq(0.5, 1, by = .1) circles_list = list() for(i in 1:length(r_vals)){ r = r_vals[i] circles_list[[i]] = tibble( len = seq(0, 2*pi, length.out = num_lines), x = r*sin(len), y = r*cos(len), size = r) } final_circle = bind_rows(circles_list) ggplot() + geom_point(data = final_circle, aes(x = x, y = y, size = size), color = "white") + coord_fixed() + labs(caption = "Ijeamaka Anyene | @ijeamaka_a") + apply_pattern_theme("#2a534a", "white") ``` ] .pull-right[  ] .footer-paths[**PATHS: PATTERN 32**] --- class: inverse-illusion, right, bottom .pull-right[ .my-white[ # ILLUSION ] ] --- class: inverse-intro, left, middle .pull-left[ ```r circle = tibble( len = seq(0, 2*pi, length.out = num_lines), x = sin(len), y = cos(len) ) ``` ] .pull-right[ .my-white[ ### For a few of the illusion visualizations the code was a bit too long to be shown on the slide. For these ones, I omitted the code of creating a circle that I reused. Its shown on the left here! ] ] --- .pull-left[ ```r circle = tibble( len = seq(0, 2*pi, length.out = 200), x = sin(len), y = cos(len)) lines_x = circle %>% filter(y > 0) %>% mutate(x = x, y = y, xend = x) %>% select(x, y, xend) lines_yend = circle %>% filter(y < 0) %>% mutate(yend = y) %>% select(yend) lines_total = bind_cols(lines_x, lines_yend) ggplot() + geom_segment(data = lines_total, aes(x = x, y = y, xend = xend, yend = yend), color = "black") + coord_fixed() + labs(caption = "Ijeamaka Anyene | @ijeamaka_a") + apply_pattern_theme(bg_hex = "white", caption_hex = "black") ``` ] .pull-right[  ] .footer-illusion[**ILLUSION: PATTERN 05**] --- .pull-left[ ```r circle = tibble( len = seq(0, 2*pi, length.out = 60), x = sin(len), y = cos(len), type = 1:60) lines_left = circle %>% filter(x < 0) %>% mutate(xend = 1.5, yend = y) lines_right = circle %>% filter(x > 0) %>% mutate(xend = -1.5, y_update = y - .01, yend = y_update) ggplot() + geom_segment(data = lines_left, aes(x = x, y = y, xend = xend, yend = yend), size = .5, color = "white") + geom_segment(data = lines_right, aes(x = x, y = y_update, xend = xend, yend = yend), size = .5, color = "white") + coord_fixed() + labs(caption = "Ijeamaka Anyene | @ijeamaka_a") + apply_pattern_theme(bg_hex = "#2d4159", caption_hex = "white") ``` ] <br> .pull-right[  ] .footer-illusion[**ILLUSION: PATTERN 07**] --- .pull-left[ ```r hori_lines = tibble( x = seq(-1, 1, by = .08), xend = seq(1, -1, by = -.08), y = -1, yend = 1) inner_circle = tibble( x = 0, y = 0, radius = 0.6) arc = tibble( x = 0, y = 0, r = .5, start = seq(0, 2 * pi, length.out = 9)[-9], end = seq(0, 2 * pi, length.out = 9)[-1], type = c("A", "B", "B", "A", "A", "B", "B", "A")) ggplot() + geom_segment(data = hori_lines, aes(x = x, xend = xend, y = y, yend = yend), size = 1) + geom_circle(data = inner_circle, aes(x0 = x, y0 = y, r = radius), size = 1, color = "white", alpha = 0.75) + geom_arc(data = arc, aes(x0 = x, y0 = y, r = r, start = start, end = end, color = type), size = 1) + scale_color_manual(values = c("white", "black")) + coord_fixed() + labs(caption = "Ijeamaka Anyene | @ijeamaka_a") + apply_pattern_theme(bg_hex = "white", caption_hex = "black") ``` ] .pull-right[  ] .footer-illusion[**ILLUSION: PATTERN 13**] --- class: inverse-illusion, right, bottom .pull-right[ .my-white[ ### For a few of these visualizations, I explored the idea of how to plot a circle without explicitly plotting a geom that creates a circle? ### <br>The easiest way for me to do so was to plot a circle using geom_point() and then use that as a framework to then recreate the circle. ] ] --- .pull-left[ ```r circle = tibble( len = seq(0, 2*pi, length.out = 61), x = sin(len), y = cos(len), type = 1:61) left = circle %>% filter(x < 0, y < 1, y > -1) %>% mutate(xend = -0.02) right = circle %>% filter(x > 0, y < 1, y > -1) %>% mutate(xend = 0.02) ggplot() + geom_segment(data = left, aes(x = x, xend = xend, y = y, yend = y), lineend = "round", color = "white", size = 1.1) + geom_segment(data = right, aes(x = x, xend = xend, y = y, yend = y), lineend = "round", color = "white", size = 1.1) + scale_x_continuous(limits = c(-1.5, 1.5)) + scale_y_continuous(limits = c(-1.5, 1.5)) + coord_fixed() + labs(caption = "Ijeamaka Anyene | @ijeamaka_a") + apply_pattern_theme(bg_hex = "#2a5c4d", caption_hex = "white") ``` ] .pull-right[  ] .footer-illusion[**ILLUSION: PATTERN 21**] --- .pull-left[ ```r circle_top = circle %>% filter(y >= 0) circle_bottom = circle %>% filter(y < 0) %>% mutate(x = x + 1) lines_top = circle %>% filter(y >= 0.055) %>% mutate(yend = y, y = 0.055, x = x + 1, xend = x) lines_bottom = circle %>% filter(y <= -0.03) %>% mutate(yend = y, y = -.03, xend = x) ggplot() + geom_segment(data = lines_top, aes(x = x, y = y, xend = xend, yend = yend), size = 0.7, lineend = "round", color = "white") + geom_segment(data = lines_bottom, aes(x = x, y = y, xend = xend, yend = yend), size = 0.7, lineend = "round", color = "white") + geom_shape(data = circle_top, aes(x, y), fill = "#cbac9a") + geom_shape(data = circle_bottom, aes(x, y), fill = "#cbac9a") + coord_fixed() + labs(caption = "Ijeamaka Anyene | @ijeamaka_a") + apply_pattern_theme("#3c5551", "white") ``` ] .pull-right[  ] .footer-illusion[**ILLUSION: PATTERN 22**] --- .pull-left[ ```r vertical_up = filter(circle, y > 0) %>% mutate(yend = 1.25, xend = x) vertical_down = filter(circle, y < 0) %>% mutate(yend = -1.25, xend = x) horizontal_left = filter(circle, x < 0) %>% mutate(xend = 0, yend = y) horizontal_right = filter(circle, x > 0) %>% mutate(xend = 0, yend = y) ggplot() + geom_segment(data = vertical_up, aes(x = x, y = y, xend = xend, yend = yend), color = "white", linejoin = "round", size = 1.25) + geom_segment(data = vertical_down, aes(x = x, y = y, xend = xend, yend = yend), color = "white", linejoin = "round", lineend = "round", size = 1) + geom_segment(data = horizontal_left, aes(x = x, y = y, xend = xend, yend = yend), color = "white", linejoin = "round", lineend = "round", size = 1) + geom_segment(data = horizontal_right, aes(x = x, y = y, xend = xend, yend = yend), color = "white", linejoin = "round", lineend = "round", size = 1) + coord_flip() + labs(caption = "Ijeamaka Anyene | @ijeamaka_a") + apply_pattern_theme("#902018", "white") ``` ] <br> .pull-right[  ] .footer-illusion[**ILLUSION: PATTERN 24**] --- .pull-left[ ```r num_lines = 4000 r_vals = seq(0.5, 1.5, by = .01) circles_list = list() for(i in 1:length(r_vals)){ r = r_vals[i] circle = tibble( len = seq(0, 2*pi, length.out = num_lines), x = r*sin(len), y = r*cos(len)) circles_list[[i]] = circle[sample(1:num_lines, num_lines/i, replace = FALSE),] } final_circle = bind_rows(circles_list) ggplot() + geom_point(data = final_circle, aes(x = x, y = y), color = "#e4cdc3", size = 0.1, alpha = 0.5) + coord_fixed() + labs(caption = "Ijeamaka Anyene | @ijeamaka_a") + apply_pattern_theme("black", "white") ``` ] .pull-right[  ] .footer-illusion[**ILLUSION: PATTERN 31**] --- .pull-left[ ```r num_lines = 100 r = 1 circle = tibble( len = seq(0, 2*pi, length.out = num_lines), x = r*sin(len), y = r*cos(len), type = 1:100) circle_test = circle[sample(1:100, 80),] ggplot() + geom_path(data = circle_test, aes(x = x, y = y, color = type), size = 0.8, alpha = 0.8) + geom_path(data = circle_test, aes(x = x, y = y, color = type), size = 0.5) + scale_colour_gradient(low = "#f7f7f7", high = "#6b7f8c") + coord_fixed() + labs(caption = "Ijeamaka Anyene | @ijeamaka_a") + apply_pattern_theme("black", "white") ``` ] .pull-right[  ] .footer-illusion[**ILLUSION: PATTERN 33**] --- class: inverse-waves, right, bottom .pull-right[ .my-white[ # WAVES ] ] --- .pull-left[ ```r circle = tibble( x = 0, y = 0, radius = seq(0.1, 1, length.out = 5)) lines = tibble( x = rep(-1, 1), y = seq(-1, .9, by = .25), xend = 1, yend = 1) ggplot() + geom_circle(data = circle, aes(x0 = 0, y0 = 0, r = 1), fill = "#8397a5", color = "#8397a5") + geom_diagonal(data = lines, aes(x, y, xend = xend, yend = yend), color = "white", size = 1) + coord_fixed() + labs(caption = "Ijeamaka Anyene | @ijeamaka_a") + apply_pattern_theme(bg_hex = "white", caption_hex = "black") ``` ] .pull-right[  ] .footer-waves[**WAVES: PATTERN 06**] --- class: inverse-waves, left, middle .pull-left[ # .my-black[pattern 06 <br>deep dive] ] .pull-right[ .my-white[ ### I really wanted to have the wave pattern overlay the circle, and not be seen outside of the circle. However, I am hopeless at geometry. ### The trick for me was to have the wave pattern overlay be the same color as my background. So I never had to calculate the endpoints of the wave pattern to align with the perimeter of my circle. ] ] --- .pull-left[ ```r waves = tibble( x = seq(0, 4, by = .25), t = 3*pi, y = 0.5*sin(9*pi - (3*pi*x))) waves_2 = tibble( x = seq(0, 4, by = .25), t = 3*pi, y = 0.5*sin(8*pi - (3*pi*x))) ggplot() + geom_path(data = waves_2, aes(x = x, y = y, color = y), size = .5) + geom_point(data = waves_2, aes(x = x, y = y, color = y), size = 1) + geom_path(data = waves, aes(x = x, y = y, color = y), size = .5) + geom_point(data = waves, aes(x = x, y = y, color = y), size = 1) + coord_polar() + scale_colour_gradient(low = "#f27d52", high = "#f2a341") + labs(caption = "Ijeamaka Anyene | @ijeamaka_a") + apply_pattern_theme(bg_hex = "#212121", caption_hex = "white") ``` ] .pull-right[  ] .footer-waves[**WAVES: PATTERN 23**] --- class: inverse-waves, left, middle .pull-left[ #.my-black[pattern 23 <br>deep dive] ] .pull-right[ .my-white[ ### I had to watch a tutorial about waves aimed at middle schoolers (maybe high schoolers?) to prepare for a tutorial about waves aimed at college students in order to create Pattern 23. ### From some minor experimenting I realized that modulating lines made interesting patterns when you use coord_polar(). I definitely recommend experimenting with it. ] ] --- class: inverse-areas, bottom, right .pull-right[ .my-white[ # AREA ] ] --- .pull-left[ ```r dots = expand.grid(x = seq(1, 10, by = .2), y = c(1:10)) dots = dots %>% mutate(type = sample(c("Y", "N"), 460, replace = TRUE)) %>% filter(type == "Y") outline = tibble( x = c(.9, .9, .9, 10.1), xend = c(10.1, 10.1, .9, 10.1), y = c(.55, 11, .55, .55), yend = c(.55, 11, 11, 11)) ggplot() + geom_point(data = dots, aes(x = x, y = y), color = "#ffffff", alpha = 0.2, size = 3) + geom_point(data = dots, aes(x = x, y = y), color = "#ffffff") + geom_segment(data = outline, aes(x = x, xend = xend, y = y, yend = yend), color = "#ffffff") + geom_segment(data = outline, aes(x = x, xend = xend, y = y, yend = yend), alpha = 0.2, size = 1.4, color = "#ffffff") + scale_y_continuous(limits = c(-2, 11)) + scale_x_continuous(limits = c(0.5, 10.5)) + coord_polar() + labs(caption = "Ijeamaka Anyene | @ijeamaka_a") + apply_pattern_theme(bg_hex = "#040404", caption_hex = "white") ``` ] .pull-right[  ] .footer-areas[**AREA: PATTERN 04**] --- .pull-left[ ```r area = tibble( x = c(1, 2, 1.5), y = c(1, .5, .25), type = LETTERS[1:3]) ggplot() + geom_col(data = area, aes(x = x, y = y, fill = type), alpha = .75, width = 2) + scale_x_continuous(limits = c(0, 3)) + scale_fill_manual(values = c("#1c2253", "#c48831", "#013237")) + coord_polar() + labs(caption = "Ijeamaka Anyene | @ijeamaka_a") + apply_pattern_theme(bg_hex = "white", caption_hex = "black") ``` ] .pull-right[  ] .footer-areas[**AREA: PATTERN 09**] --- class: inverse-areas, left, middle .pull-left[ # .my-black[pattern 09 <br> deep dive] ] .pull-right[ .my-white[ ### Pattern 09 and a few others all started as a typical pie chart. For all of them I created bar charts, but with overlapping but not perfectly aligned columns. This is done by modifying their x-values and playing with the widths. <br> ### I also changed up the heights between the columns which allowed for the pie wedges to be of different heights. ] ] --- .pull-left[ ```r area = tibble( x = c(1, 2, 3), y = c(1, .5, .25), type = LETTERS[1:3]) palette_values = c("#13361c", "#354151", "#e4b453") ggplot() + geom_col(data = area, aes(x = x, y = y, fill = type), alpha = .75, width = 2) + scale_fill_manual(values = palette_values) + scale_x_continuous(limits = c(0, 4)) + coord_polar() + labs(caption = "Ijeamaka Anyene | @ijeamaka_a") + apply_pattern_theme(bg_hex = "white", caption_hex = "black") ``` ] .pull-right[  ] .footer-areas[**AREA: PATTERN 14**] --- .pull-left[ ```r outline = tibble( x = 1, xend = 7, y = 15, yend = 15) segment_line = tibble( x = c(1, 7), xend = c(1, 7), y = c(0, 2), yend = 15) area = tibble( x = c(3, 5, 6), y = c(5, 7.5, 2), type = LETTERS[1:3]) palette_values = c("#2a2640", "#a64e46", "#f29544") ggplot() + geom_col(data = area, aes(x = x, y = y, fill = type), alpha = 0.75, width = 4) + geom_segment(data = outline, aes(x = x, y = y, xend = xend, yend = yend), size = 0.5) + geom_segment(data = segment_line, aes(x = x, xend = xend, y = y, yend = yend), size = 0.5) + geom_point(aes(x = 5, y = 0)) + scale_fill_manual(values = palette_values) + scale_y_continuous(limits = c(0, 15)) + scale_x_continuous(limits = c(1, 10)) + coord_polar() + labs(caption = "Ijeamaka Anyene | @ijeamaka_a") + apply_pattern_theme(bg_hex = "#ded5c9", caption_hex = "black") ``` ``` ## Warning: position_stack requires non-overlapping x intervals ``` ] .pull-right[  ] .footer-areas[**AREA: PATTERN 19**] --- .pull-left[ ```r ggplot() + geom_circle(aes(x0 = 0, y0 = 0, r = 1), fill = "#f97d4e", color = "#f97d4e", alpha = 0.95) + geom_circle(aes(x0 = 0.15, y0 = .15, r = 0.85), fill = "#2e2137", color = "#2e2137") + coord_fixed() + labs(caption = "Ijeamaka Anyene | @ijeamaka_a") + apply_pattern_theme("#2e2137", "white") ``` ] .pull-right[  ] .footer-areas[**AREA: PATTERN 25**] --- .pull-left[ ```r cols = tibble( x = 1:5, y = 5:1, type = LETTERS[1:5]) palette_values = c("#312f39", "#38394c", "#ededed", "#141419", "#000000") ggplot() + geom_col(data = cols, aes(x = x, y = y, fill = type), width = 3) + scale_fill_manual(values = palette_values) + coord_polar() + labs(caption = "Ijeamaka Anyene | @ijeamaka_a") + apply_pattern_theme("white", "black") ``` ] .pull-right[  ] .footer-areas[**AREA: PATTERN 27**] --- .pull-left[ ```r ggplot() + geom_col(aes(x = 1, y = 1), fill = "#8c8c94", color = "#8c8c94", width = 1) + geom_col(aes(x = 1.25, y = .75), fill = "#e7e8ec", color = "#e7e8ec", width = .75) + labs(caption = "Ijeamaka Anyene | @ijeamaka_a") + coord_polar() + apply_pattern_theme("#0b0624", "white") ``` ] .pull-right[  ] .footer-areas[**AREA: PATTERN 29**] --- .pull-left[ ```r num_lines = 400 circle = tibble( len = seq(0, 2*pi, length.out = num_lines), x = sin(len), y = cos(len)) triangle_left = circle %>% mutate(xend = x, x = -1, yend = y, y = 0) ggplot() + geom_polygon(data = circle, aes(x = x, y = y), fill = "#ab3a3a") + geom_segment(data = triangle_left, aes(x = x, xend = xend, y = y, yend = yend), color = "white", size = 0.3, lineend = "round") + coord_fixed() + labs(caption = "Ijeamaka Anyene | @ijeamaka_a") + apply_pattern_theme("white", "black") ``` ] .pull-right[  ] .footer-areas[**AREA: PATTERN 34**] --- class: inverse-intro, left, middle .pull-left[ ## Thanks for viewing! ## Check out more of my work at: ijeamaka-anyene.netlify.app <br> <br>Ijeamaka Anyene, 2021 ] .pull-right[ .my-white[ <br> <br> The art in this project is released under a CC BY-NC-SA 4.0 Creative Commons license. You can copy and redistribute the material, and are free to remix and build upon the material while giving me credit. However, you cannot use for commercial purposes without contacting me. ] ]