background-image: url(images/flower_cover_art_v5.png) background-size: cover class: left, bottom <style type="text/css"> code.r.hljs.remark-code { position: relative; overflow-x: hidden; } code.r.hljs.remark-code:hover { overflow-x: visible; width: 500px; border-style: solid; } </style> .my-white[ # aRt + ggplot: exploring radial visualizations **Ijeamaka Anyene** **RLadies Johannesburg & Tunis Meetup | January 14th, 2021** ] --- class: transition-slide-blue, center, middle .my-green[ # computational aRt ] -- .my-green[ # creative coding ] -- .my-white[ ### definition: model, simulate or replicate creativity using a computer ] <br> -- .my-white[ ### ...but in #rstats ] --- class: transition-gradient-blue, center, middle .pull-left[ .my-white[ # Generative Art <br> ### algorithm or rule set entered into an "autonomous system" defines the design of the art ] ] .pull-right[ <img src="images/geokaramanis_genuary.jpeg" width="90%" style="display: block; margin: auto;" /> <br> ### Georgios Karamanis @geokaraminis ] --- class: transition-slide-blue, center, middle .my-white[ ### An algorithm is just a well-defined set of instructions ] --- .pull-left[ ```r num_lines = 80 lines = tibble( x = 1:num_lines, xend = x, y = 1, yend = 10) overlap_lines = tibble( x = 40:80, xend = x, y = 5, yend = 1) ggplot() + geom_segment(data = lines, aes(x = x, xend = xend, y = y, yend = yend)) + geom_segment(data = overlap_lines, aes(x = x, xend = xend, y = y, yend = yend), color = "white", size = .7) + coord_polar() ``` ] .pull-right[ <img src="images/pattern_17.png" width="80%" style="display: block; margin: auto;" /> <br> .center[**Pattern 17: Radial Patterns in ggplot2**] ] --- background-image: url(images/patterns_cover_3.png) background-size: cover --- background-image: url(images/zine_excerpt.png) background-size: cover --- class: transition-slide-blue, middle .my-green[ # Why do computational art? ] -- .my-white[ ### 1. It is fun! ] -- .my-white[ ### 2. It can be as simple or as complicated as you like. ] -- .my-yellow[ ### 3. Exploring computational art can lead to inspiration for your data visualizations. ] --- .pull-left[ ### .center[Computational Art] <img src="images/pattern_3.png" width="80%" style="display: block; margin: auto;" /> ] .pull-right[ ### .center[TidyTuesday: Data Visualization] <img src="images/2020-16_avatar.png" width="80%" style="display: block; margin: auto;" /> ] -- .center[ ### Both images use the same visualization techniques ] --- .pull-left[ ### .center[Pattern 1] <img src="images/pattern_1.png" width="80%" style="display: block; margin: auto;" /> ] .pull-right[ ### .center[Pattern 2] <img src="images/pattern_3.png" width="80%" style="display: block; margin: auto;" /> ] .center[ ### Case Study: A Lesson About Segments ] --- class: transition-slide-blue, center, middle ### .my-green[Concept 1: ] .my-white[Horizontal vs. vertical segments have different appearances in the polar coordinate system] -- ### .my-green[Concept 2: ] .my-white[Using a polar coordinate system is one of the easiest ways to make a radial-based visualization] --- class: center, middle, transition-slide-blue .my-white[ # My ride or die geom ] -- .my-white[ ### geom_segment() ] .my-white[ ### creates a straight line between points (x, y) and (xend, yend) ] --- ```r ggplot() + geom_segment(aes(x = 0, xend = 10, y = 1, yend = 1), size = 5) ``` <img src="index_files/figure-html/plot_geom_segment-1.png" width="720" style="display: block; margin: auto;" /> --- .pull-left[ ```r ggplot() + geom_segment(aes(x = 0, xend = 10, y = 1, yend = 1), size = 5) ``` <img src="index_files/figure-html/horizontal_segment-1.png" width="504" style="display: block; margin: auto;" /> ] .pull-right[ ```r ggplot() + geom_segment(aes(x = 0, xend = 10, y = 1, yend = 1), size = 5) + * coord_polar() ``` <img src="index_files/figure-html/coord_horizontal_segment-1.png" width="504" style="display: block; margin: auto;" /> ] --- .pull-left[ ```r ggplot() + geom_segment(aes(x = 5, xend = 5, y = 1, yend = 10), size = 5) ``` <img src="index_files/figure-html/vertical_segment-1.png" width="504" style="display: block; margin: auto;" /> ] .pull-right[ ```r ggplot() + geom_segment(aes(x = 5, xend = 5, y = 1, yend = 10), size = 5) + * coord_polar() ``` <img src="index_files/figure-html/coord_vertical_segment-1.png" width="504" style="display: block; margin: auto;" /> ] --- class: transition-gradient-blue, middle, center .pull-left[ .my-white[ # Computational Art: First Pattern ] ] .pull-right[ <img src="images/pattern_1.png" width="90%" style="display: block; margin: auto;" /> ] --- .pull-left[ ```r lines = tibble( x = seq(0, 19, by = .5), xend = x, y = rep(0, 39), yend = c(rep(c(5, 10), 19), 5)) ggplot() + geom_segment(data = lines, aes(x = x, xend = xend, y = y, yend = yend)) ``` ] .pull-right[ <img src="index_files/figure-html/unnamed-chunk-10-1.png" width="504" style="display: block; margin: auto;" /> ] --- .pull-left[ ```r dots = lines %>% select(x, yend) ggplot() + geom_segment(data = lines, aes(x = x, xend = xend, y = y, yend = yend)) + geom_point(data = dots, aes(x = x, y = yend)) ``` ] .pull-right[ <img src="index_files/figure-html/unnamed-chunk-12-1.png" width="504" style="display: block; margin: auto;" /> ] --- .pull-left[ ```r ggplot() + geom_segment(data = lines, aes(x = x, xend = xend, y = y, yend = yend)) + geom_point(data = dots, aes(x = x, y = yend)) + * coord_polar() ``` ] .pull-right[ 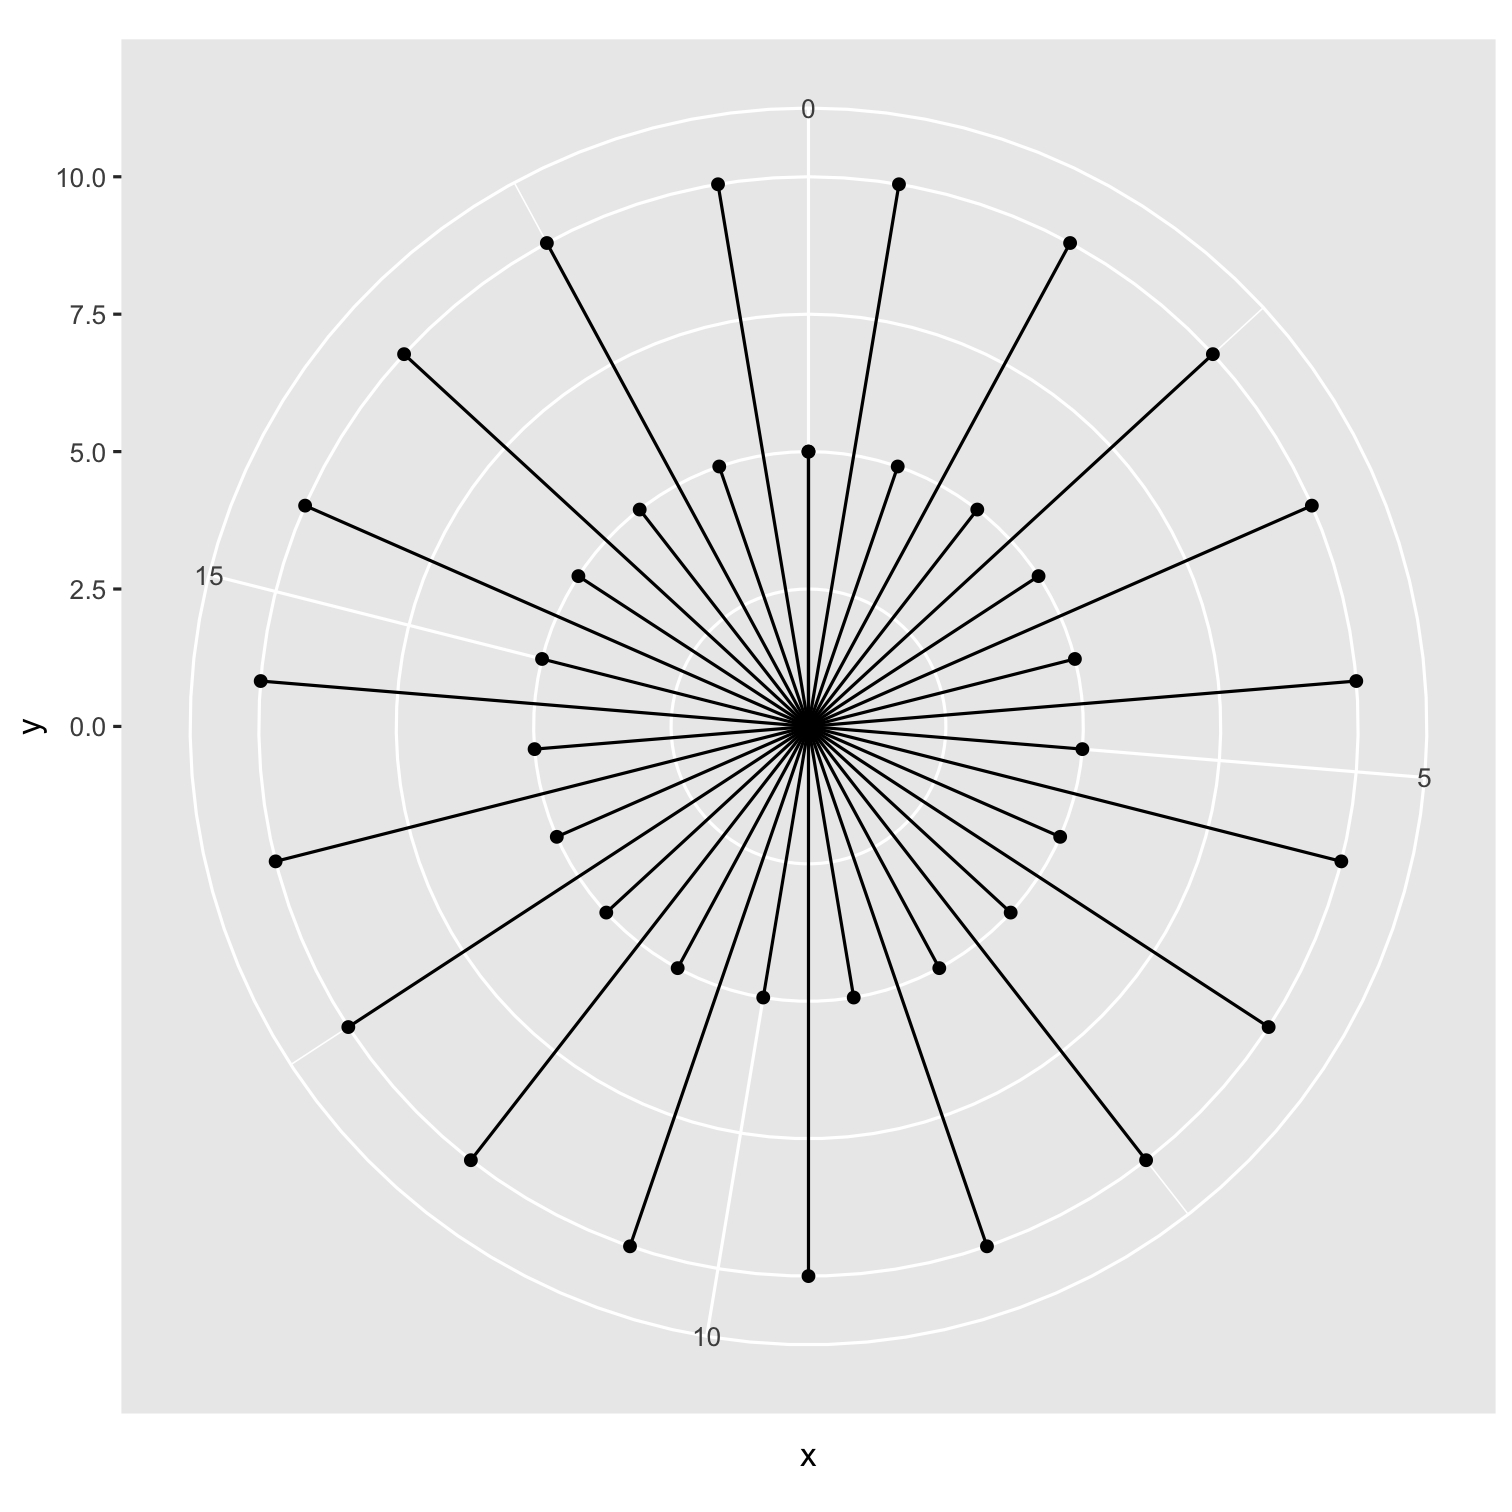 ] --- .pull-left[ ```r ggplot() + geom_segment(data = lines, aes(x = x, xend = xend, y = y, yend = yend)) + geom_point(data = dots, aes(x = x, y = yend)) + * ylim(-5, 10) #+ ``` ```r #coord_polar() ``` ] .pull-right[ 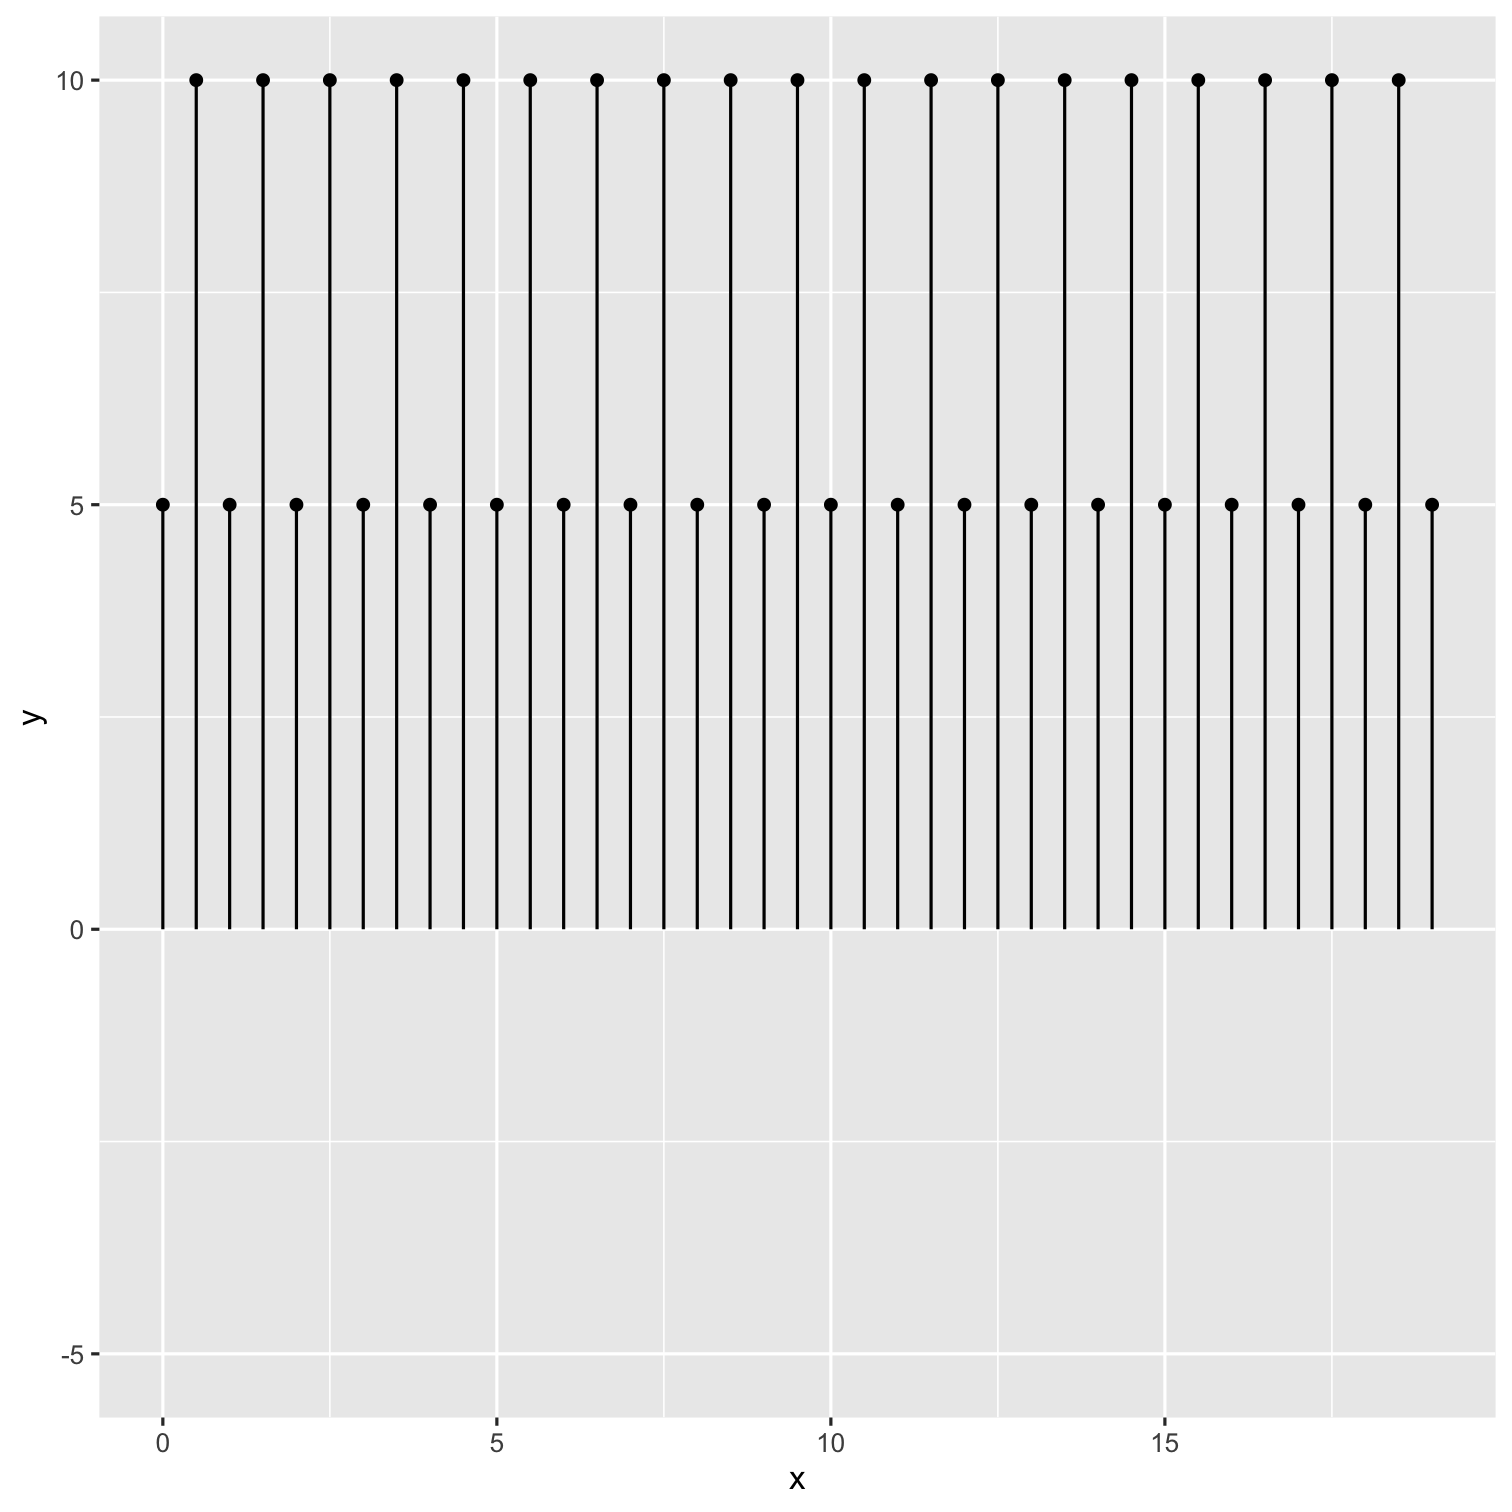 ] --- .pull-left[ ```r ggplot() + geom_segment(data = lines, aes(x = x, xend = xend, y = y, yend = yend)) + geom_point(data = dots, aes(x = x, y = yend)) + * ylim(-5, 10) + coord_polar() ``` ] .pull-right[ 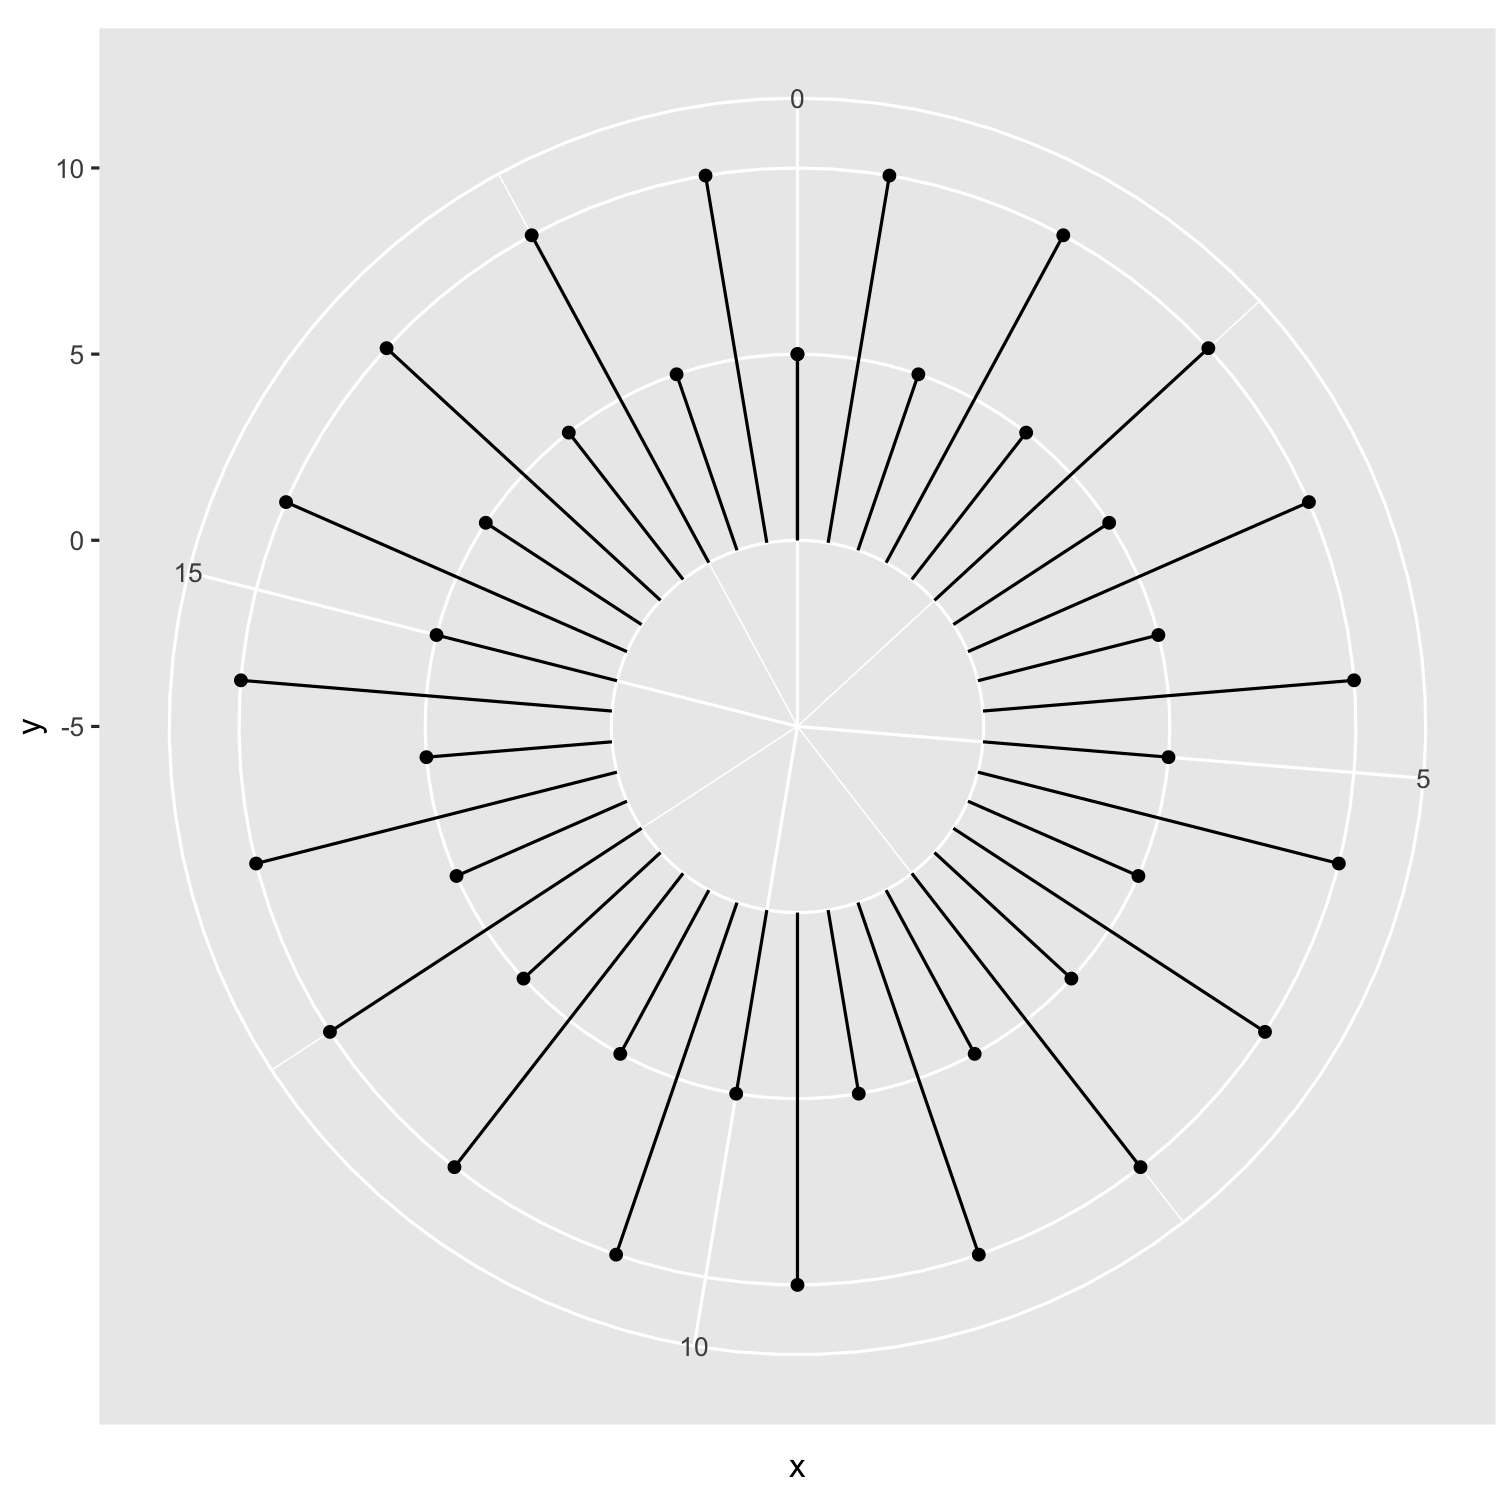 ] --- .pull-left[ ```r ggplot() + geom_segment(data = lines, aes(x = x, xend = xend, y = y, yend = yend), * color = "white") + geom_point(data = dots, aes(x = x, y = yend), * color = "white") + scale_y_continuous(limits = c(-5, 10)) + coord_polar() + theme( plot.background = element_rect( fill = "#75926f"), panel.background = element_rect( fill = "#75926f"), panel.grid = element_blank(), plot.caption = element_text( family = "Open Sans", size = 6, color = "white"), axis.title = element_blank(), axis.text = element_blank(), axis.ticks = element_blank() ) ``` ] .pull-right[ 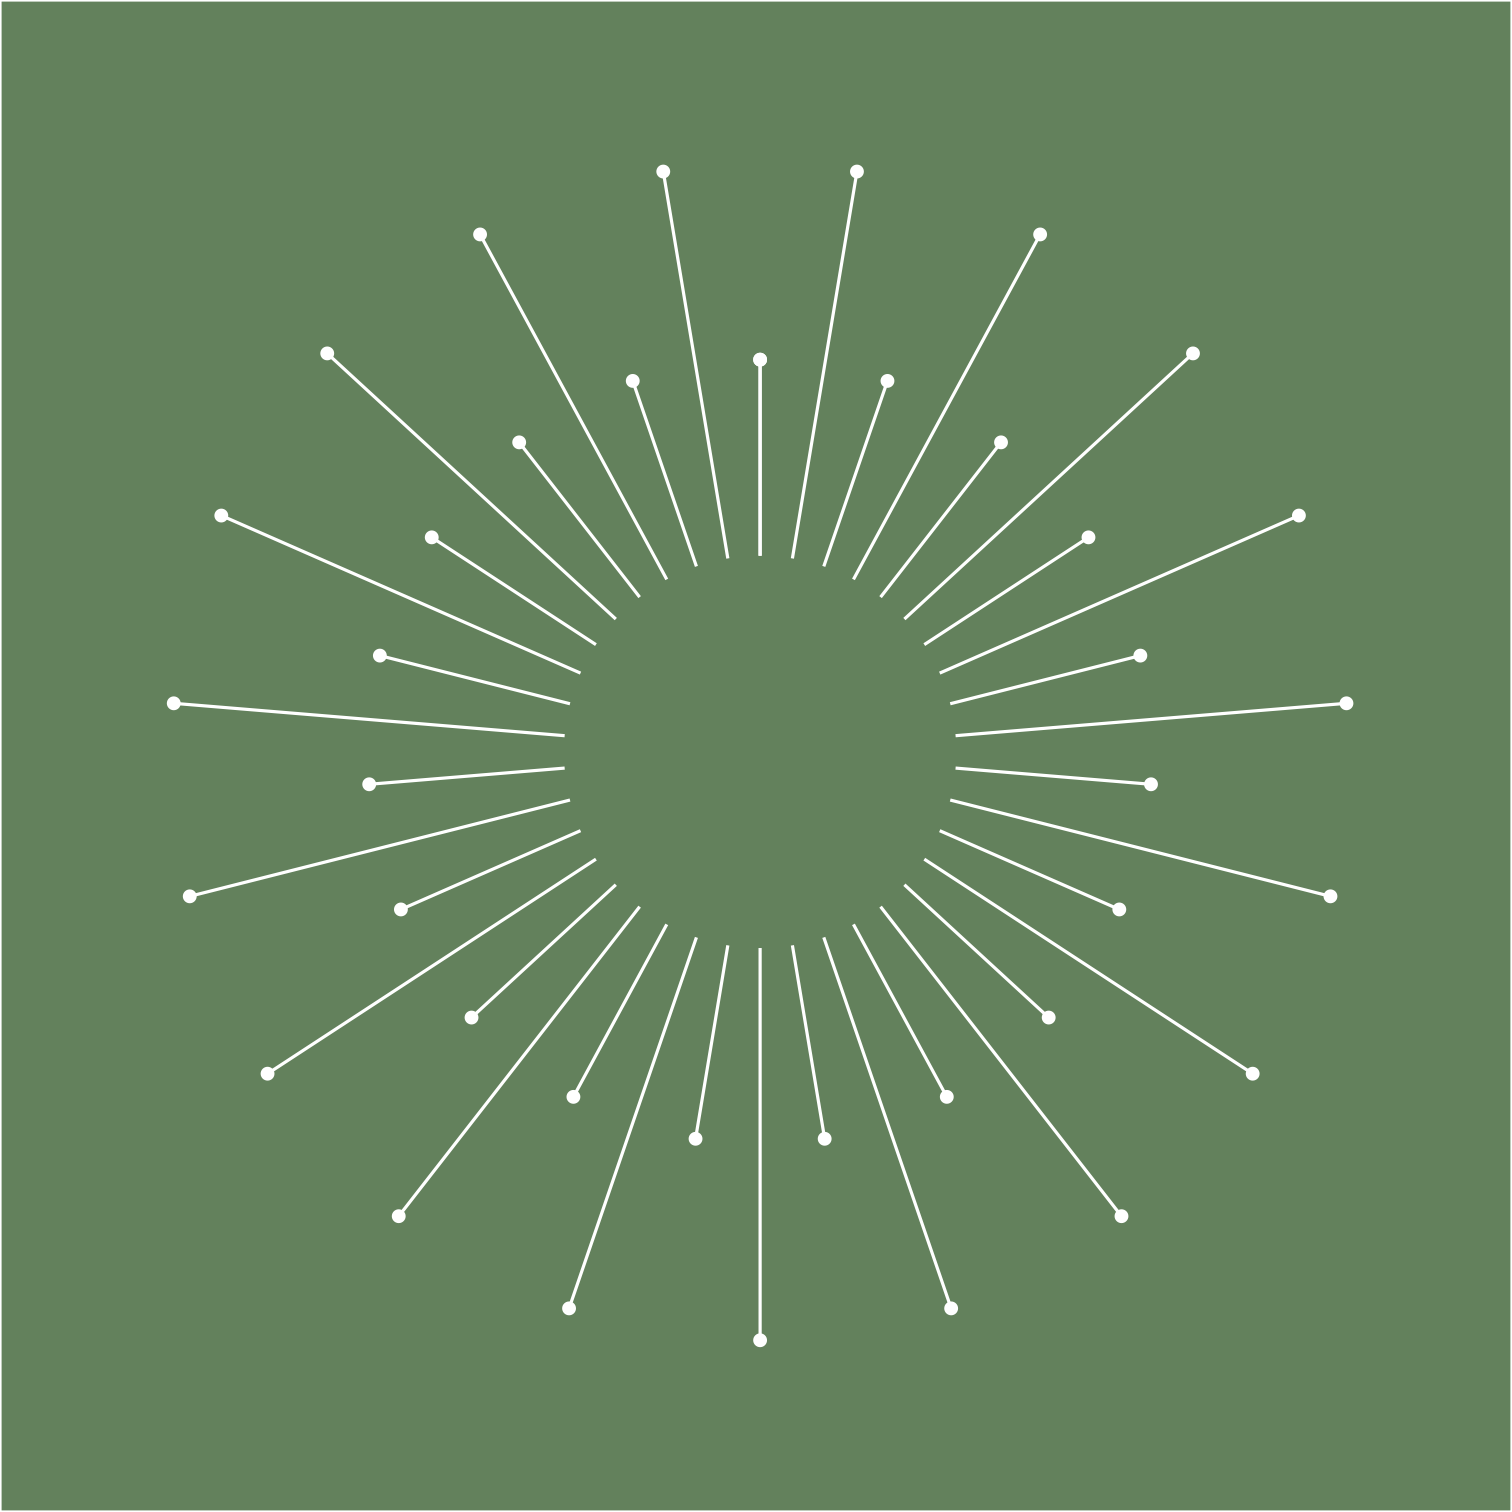 ] --- class: transition-gradient-blue, middle, center .pull-left[ .my-white[ # Computational Art: Second Pattern ] ] .pull-right[ <img src="images/pattern_3.png" width="90%" style="display: block; margin: auto;" /> ] --- .pull-left[ ```r center_circle = tibble( x = seq(0, 19, by = .5), xend = x, y = rep(0, length(x)), yend = rep(3, length(x))) ggplot() + geom_segment(data = center_circle, aes(x = x, xend = xend, y = y, yend = yend)) ``` ] .pull-right[ <img src="index_files/figure-html/unnamed-chunk-15-1.png" width="504" style="display: block; margin: auto;" /> ] --- .pull-left[ ```r outer_circle = center_circle %>% mutate(y = yend, yend = yend + 6) ggplot() + geom_segment(data = center_circle, aes(x = x, xend = xend, y = y, yend = yend)) + geom_segment(data = outer_circle, aes(x = x, xend = xend, y = y, yend = yend)) ``` ] .pull-right[ <img src="index_files/figure-html/unnamed-chunk-17-1.png" width="504" style="display: block; margin: auto;" /> ] --- .pull-left[ ```r ggplot() + geom_segment(data = center_circle, aes(x = x, xend = xend, y = y, yend = yend), * size = 0.5) + geom_segment(data = outer_circle, aes(x = x, xend = xend, y = y, yend = yend), * size = 2) ``` <br><br> **Change the size of the line segments**<br> ] .pull-right[ 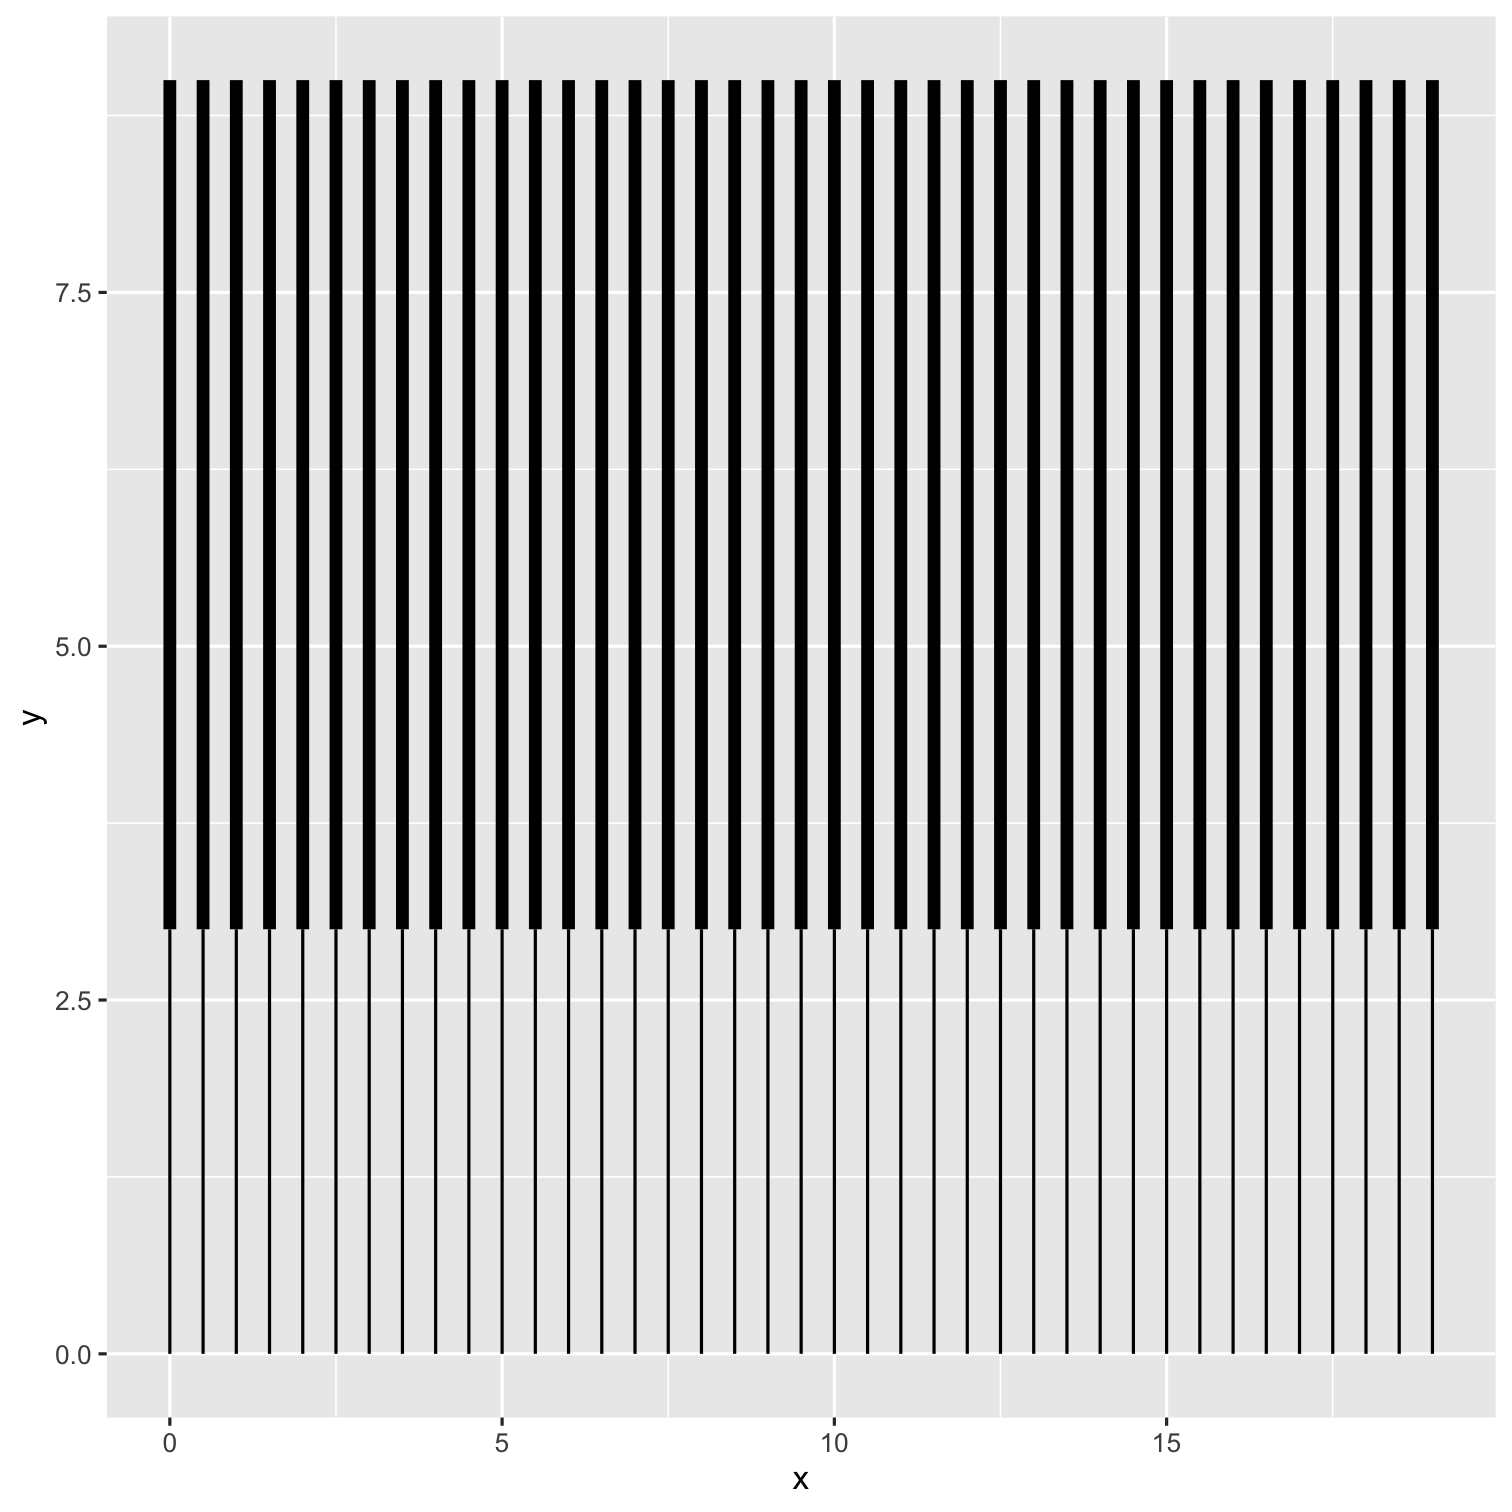 ] --- .pull-left[ ```r ggplot() + geom_segment(data = center_circle, aes(x = x, xend = xend, y = y, yend = yend), size = 0.5) + geom_segment(data = outer_circle, aes(x = x, xend = xend, y = y, yend = yend), size = 2) + * coord_polar() ``` <br><br> **Change to polar coordinate system for visualization to be a circle** ] .pull-right[ 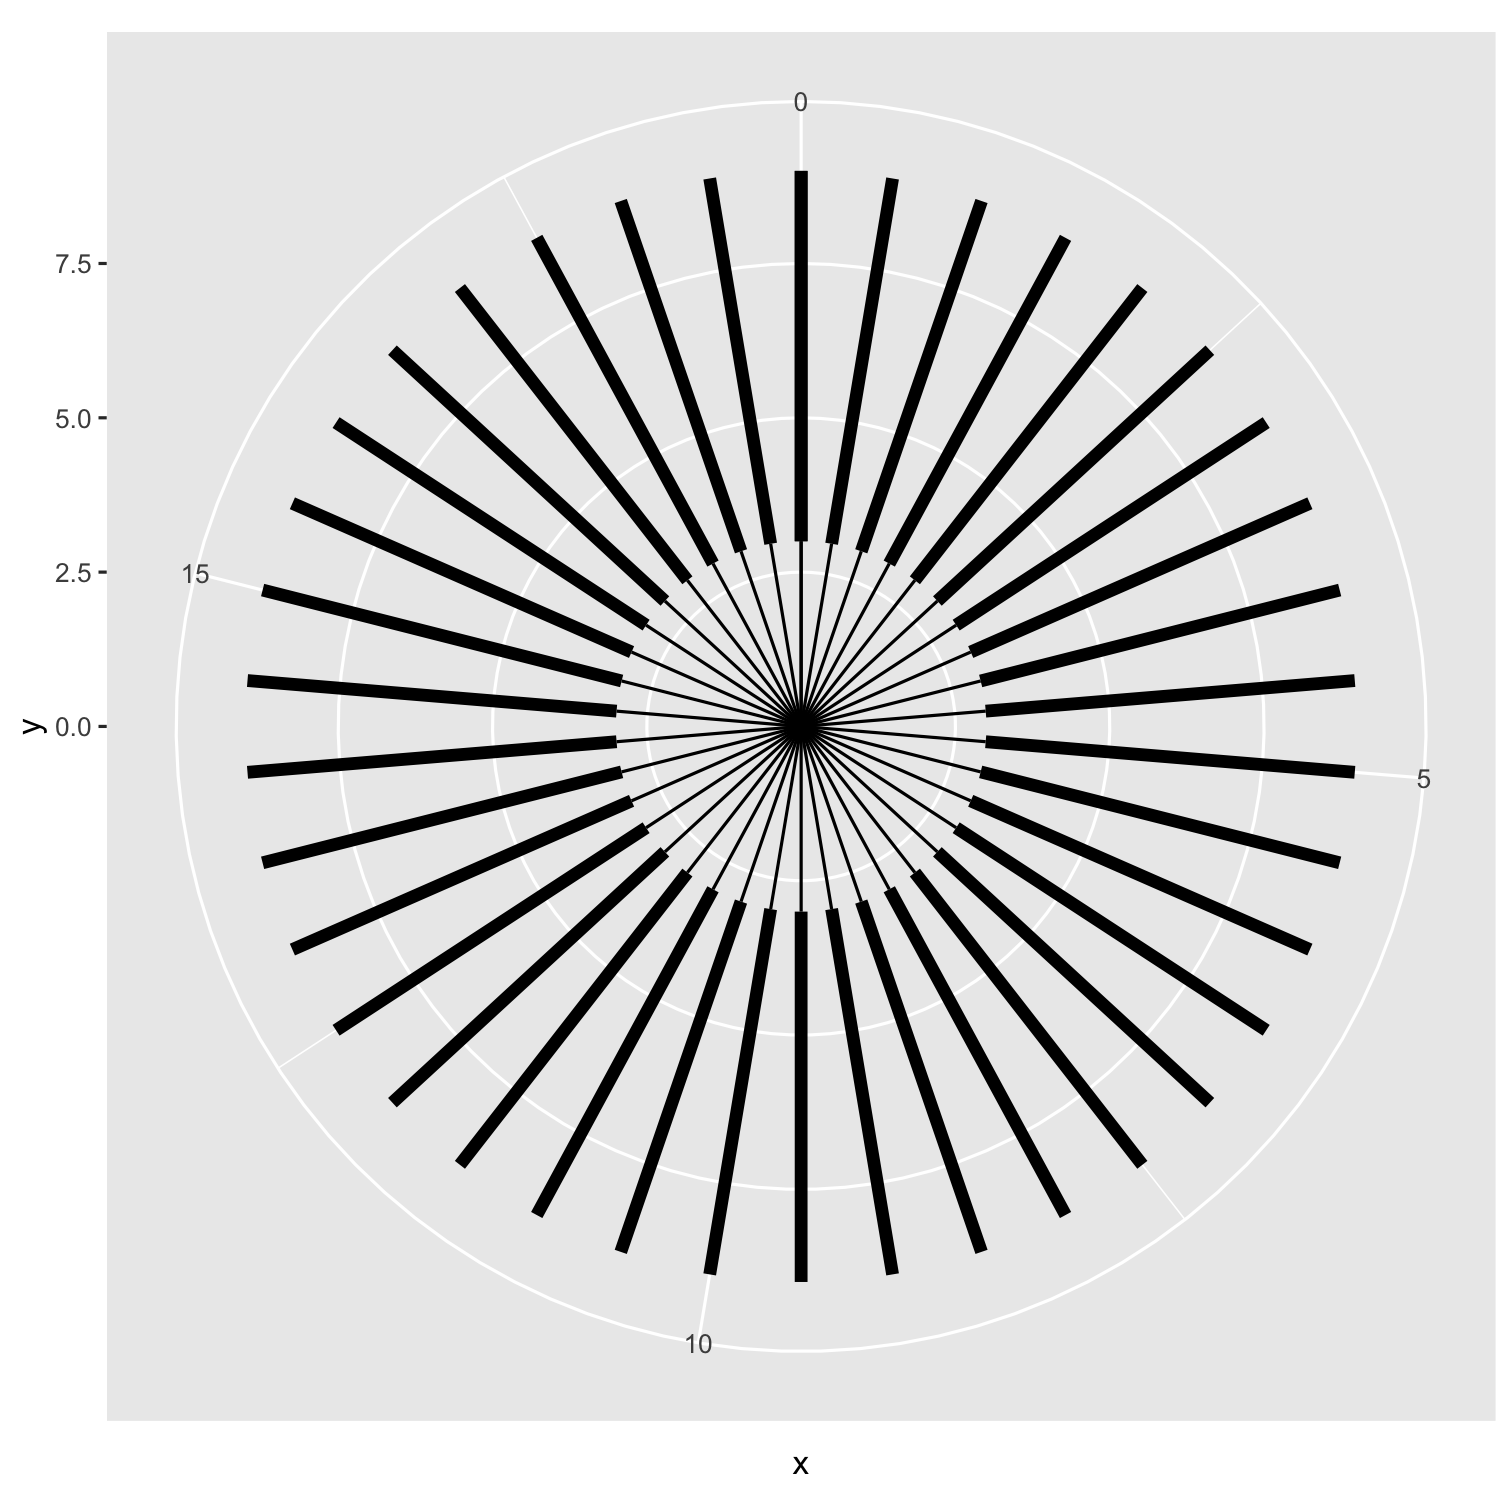 ] --- .pull-left[ ```r ggplot() + geom_segment(data = center_circle, aes(x = x, xend = xend, y = y, yend = yend), size = 0.5) + geom_segment(data = outer_circle, aes(x = x, xend = xend, y = y, yend = yend), size = 2) + #coord_polar() + * ylim(-2, 10) ``` <br><br> **Modify `ylim()` to change the appearance of the center of the circle** ] .pull-right[ 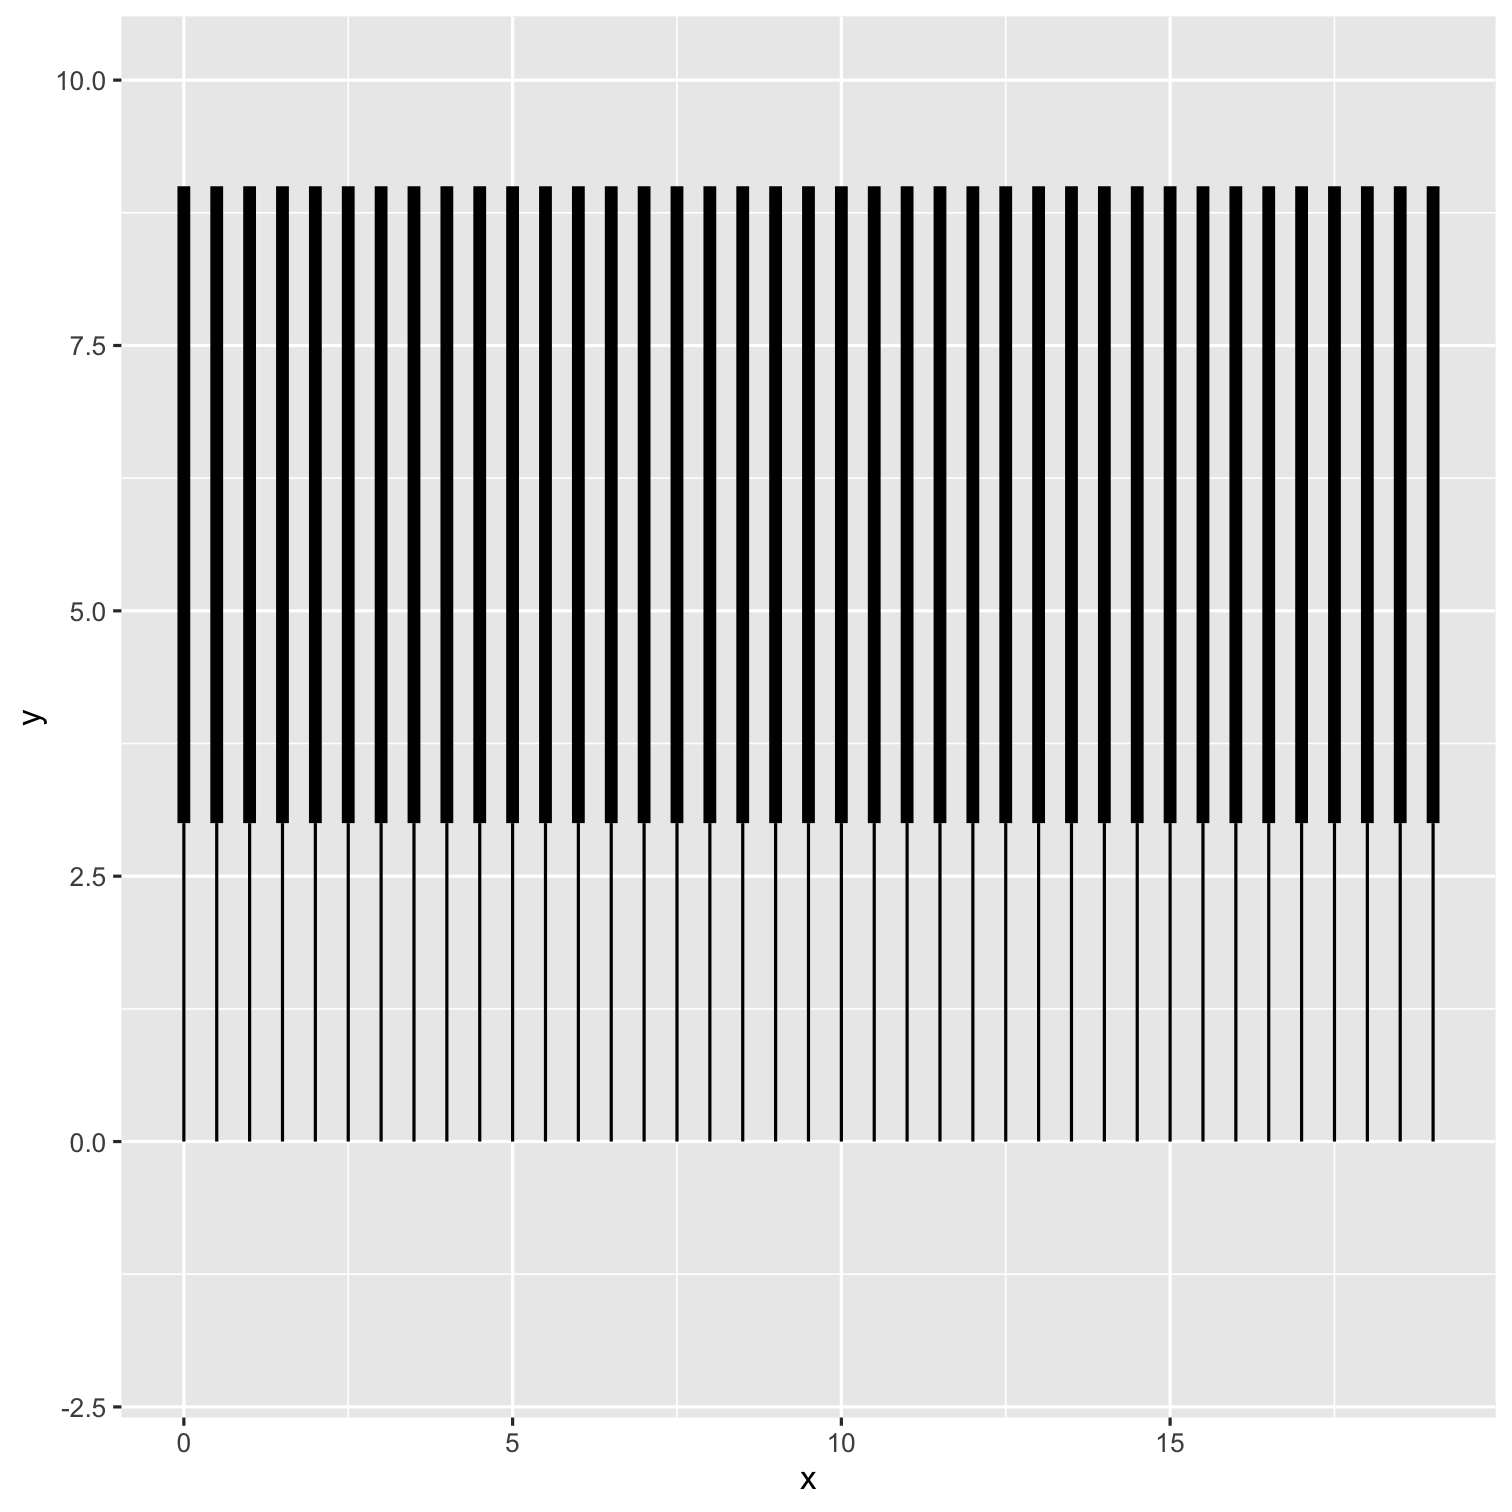 ] --- .pull-left[ ```r ggplot() + geom_segment(data = center_circle, aes(x = x, xend = xend, y = y, yend = yend), size = 0.5) + geom_segment(data = outer_circle, aes(x = x, xend = xend, y = y, yend = yend), size = 2) + coord_polar() + * ylim(-2, 10) ``` <br><br> **Modify `ylim()` to change the appearance of the center of the circle** ] .pull-right[ 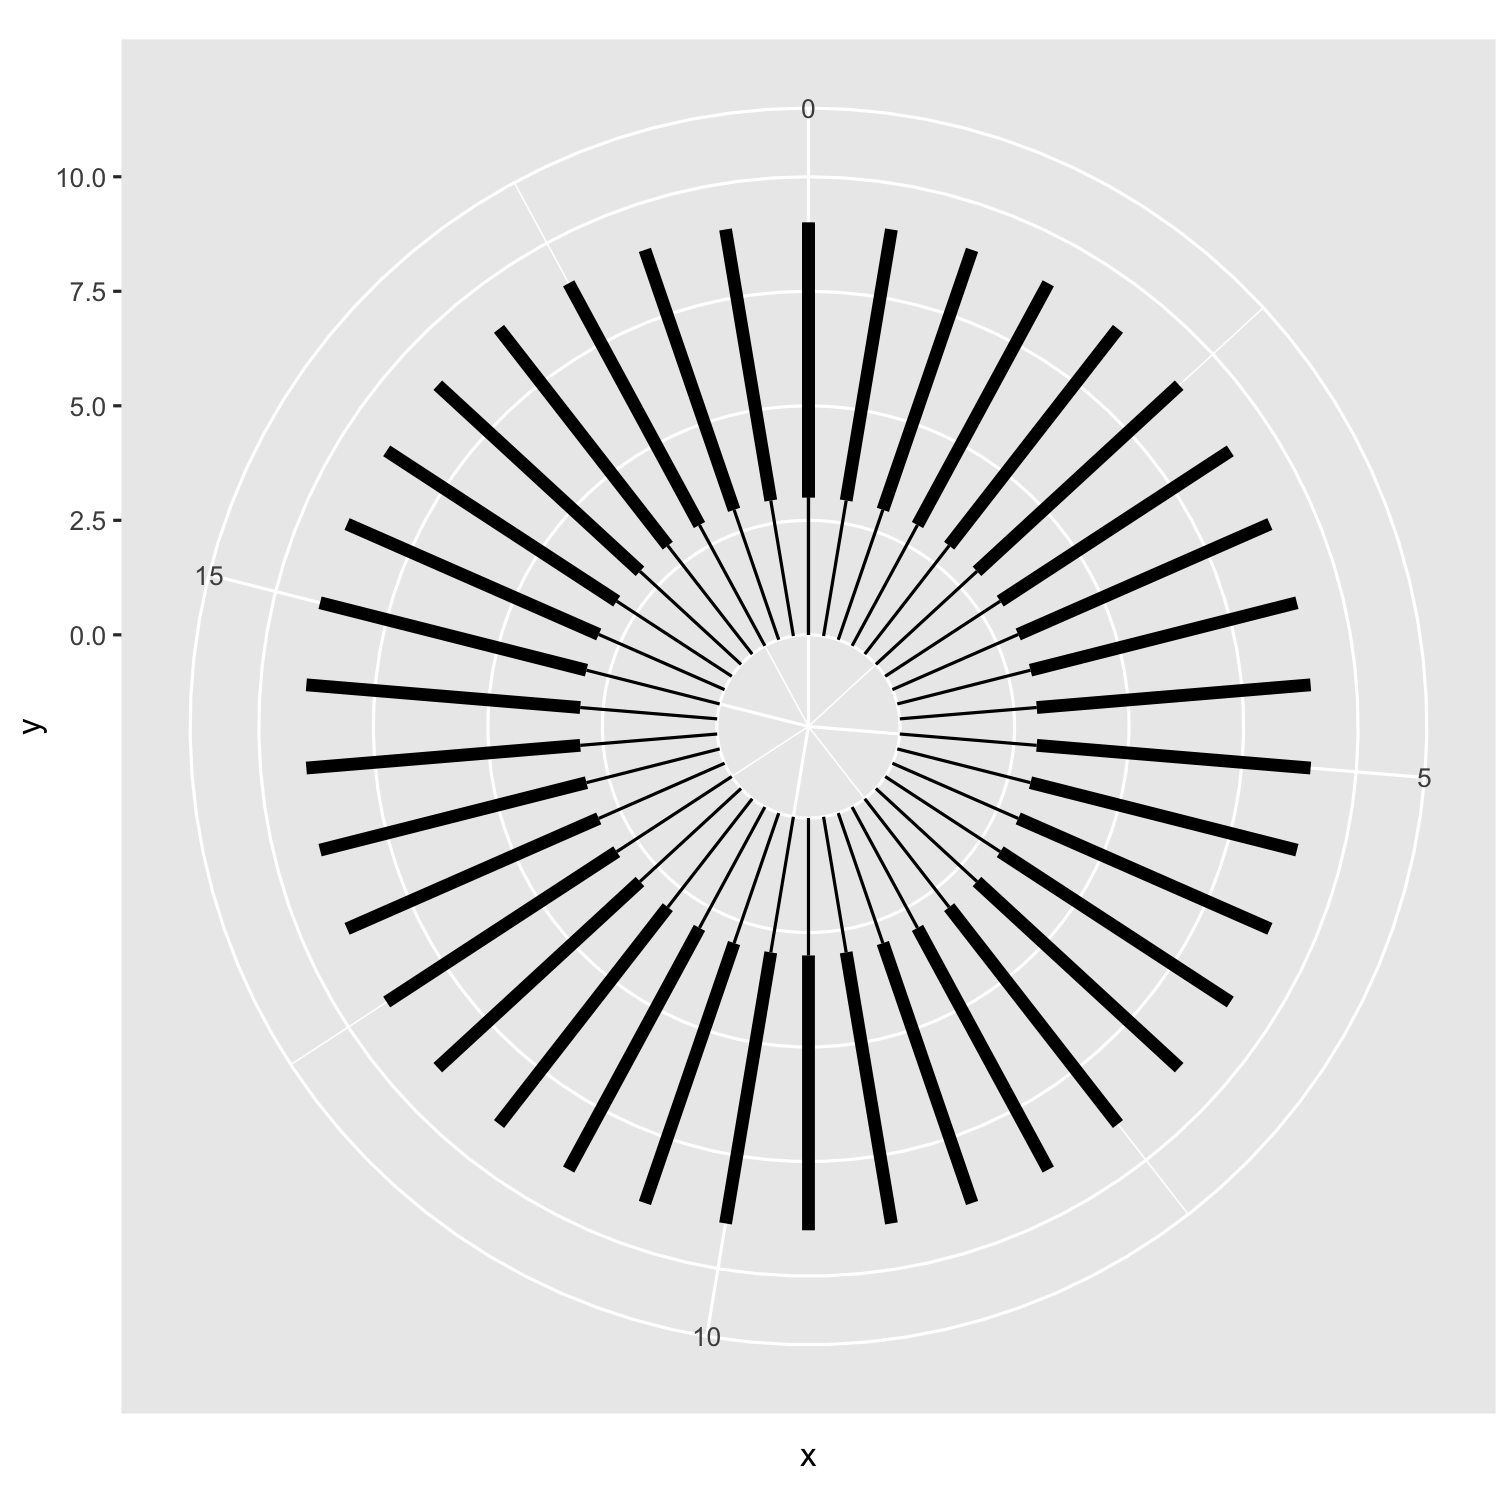 ] --- .pull-left[ ```r ggplot() + geom_segment(data = center_circle, aes(x = x, xend = xend, y = y, yend = yend), size = 0.5, * color = "white") + geom_segment(data = outer_circle, aes(x = x, xend = xend, y = y, yend = yend), size = 2, * color = "white") + ylim(-2, 10) + coord_polar() + theme( * plot.background = element_rect( * fill = "#8a484a"), * panel.background = element_rect( * fill = "#8a484a"), * panel.grid = element_blank(), * axis.title = element_blank(), * axis.text = element_blank(), * axis.ticks = element_blank() ) ``` ] .pull-right[  ] --- class: transition-gradient-blue, middle, center .pull-left[ .my-white[ # What tricks have we covered? ] ] .pull-right[ ### 1. How to have the line segment seem to end in another geom ### 2. How to have the line segment "change" appearance ### 3. coord_polar() is a magical coordinate system ] --- class: transition-gradient-blue, middle .pull-left[ .my-white[ # Create the TidyTuesday Visualization ] ] .pull-right[ <img src="images/2020-16_avatar.png" width="90%" style="display: block; margin: auto;" /> ] --- # TidyTuesday 2020: Week 3 Avatar! <table> <thead> <tr> <th style="text-align:right;"> id </th> <th style="text-align:left;"> book </th> <th style="text-align:right;"> book_num </th> <th style="text-align:left;"> chapter </th> <th style="text-align:right;"> chapter_num </th> <th style="text-align:left;"> character </th> </tr> </thead> <tbody> <tr> <td style="text-align:right;"> 1 </td> <td style="text-align:left;"> Water </td> <td style="text-align:right;"> 1 </td> <td style="text-align:left;"> The Boy in the Iceberg </td> <td style="text-align:right;"> 1 </td> <td style="text-align:left;"> Katara </td> </tr> <tr> <td style="text-align:right;"> 2 </td> <td style="text-align:left;"> Water </td> <td style="text-align:right;"> 1 </td> <td style="text-align:left;"> The Boy in the Iceberg </td> <td style="text-align:right;"> 1 </td> <td style="text-align:left;"> Scene Description </td> </tr> <tr> <td style="text-align:right;"> 3 </td> <td style="text-align:left;"> Water </td> <td style="text-align:right;"> 1 </td> <td style="text-align:left;"> The Boy in the Iceberg </td> <td style="text-align:right;"> 1 </td> <td style="text-align:left;"> Sokka </td> </tr> <tr> <td style="text-align:right;"> 4 </td> <td style="text-align:left;"> Water </td> <td style="text-align:right;"> 1 </td> <td style="text-align:left;"> The Boy in the Iceberg </td> <td style="text-align:right;"> 1 </td> <td style="text-align:left;"> Scene Description </td> </tr> <tr> <td style="text-align:right;"> 5 </td> <td style="text-align:left;"> Water </td> <td style="text-align:right;"> 1 </td> <td style="text-align:left;"> The Boy in the Iceberg </td> <td style="text-align:right;"> 1 </td> <td style="text-align:left;"> Katara </td> </tr> <tr> <td style="text-align:right;"> 6 </td> <td style="text-align:left;"> Water </td> <td style="text-align:right;"> 1 </td> <td style="text-align:left;"> The Boy in the Iceberg </td> <td style="text-align:right;"> 1 </td> <td style="text-align:left;"> Sokka </td> </tr> </tbody> </table> --- <table> <thead> <tr> <th style="text-align:left;"> character </th> <th style="text-align:left;"> full_text </th> </tr> </thead> <tbody> <tr> <td style="text-align:left;"> Katara </td> <td style="text-align:left;"> Water. Earth. Fire. Air. My grandmother used to tell me stories about the old days: a time of peace when the Avatar kept balance between the Water Tribes, Earth Kingdom, Fire Nation and Air Nomads. But that all changed when the Fire Nation attacked. Only the Avatar mastered all four elements; only he could stop the ruthless firebenders. But when the world needed him most, he vanished. A hundred years have passed, and the Fire Nation is nearing victory in the war. Two years ago, my father and the men of my tribe journeyed to the Earth Kingdom to help fight against the Fire Nation, leaving me and my brother to look after our tribe. Some people believe that the Avatar was never reborn into the Air Nomads and that the cycle is broken, but I haven't lost hope. I still believe that, somehow, the Avatar will return to save the world. </td> </tr> <tr> <td style="text-align:left;"> Scene Description </td> <td style="text-align:left;"> As the title card fades, the scene opens onto a shot of an icy sea before panning slowly to the left, revealing more towering icebergs drifting in the water as the shot rotates, moving over a large snow-covered area where the untouched blanket of snow is broken by two tracks of footsteps. The shot fades to another shot of the sea and of icebergs in blue water contrasted by the paleness of the sky beyond. As the shot once again pans to the left and rotates likewise, a small canoe comes into view, its motion through the water indicated by the wake left behind it. The shot zooms slightly on the canoe before cutting down to it, providing a side angle of the canoe and of the walls of ice rising on either side of the vessel. Two people, a boy and a girl, are sitting in the boat; the boy holds a spear at the ready, while the girl simply stares into the water on the other side of the boat. The shot cuts to an overhead view, revealing that a fish is swimming close to the surface right in front of the boy, who is focused on it, following its every movement. Cut to a frontal view of him. </td> </tr> </tbody> </table> --- class: center, middle <img src="images/avatar/appa.png" width="40%" style="display: block; margin: auto;" /> ### Who mentioned Appa and how many times per episode? --- .pull-left[ ### Visualization Aims ### 1. We want a spoke-type radial visualization. ### 2. Each episode/chapter is a line segment. ### 3. Length of the line segment is the number of mentions of Appa per chapter. ### 4. The line segment should have two different appearances ] .pull-right[ <br><br> <table class="table" style="font-size: 15px; width: auto !important; margin-left: auto; margin-right: auto;"> <thead> <tr> <th style="text-align:right;"> book_num </th> <th style="text-align:right;"> chapter_seq </th> <th style="text-align:right;"> mention_max </th> <th style="text-align:left;"> character </th> <th style="text-align:right;"> appa_mentions_sum </th> </tr> </thead> <tbody> <tr> <td style="text-align:right;"> 1 </td> <td style="text-align:right;"> 1 </td> <td style="text-align:right;"> 15 </td> <td style="text-align:left;"> Aang </td> <td style="text-align:right;"> 10 </td> </tr> <tr> <td style="text-align:right;"> 1 </td> <td style="text-align:right;"> 2 </td> <td style="text-align:right;"> 15 </td> <td style="text-align:left;"> Aang & Katara </td> <td style="text-align:right;"> 6 </td> </tr> <tr> <td style="text-align:right;"> 1 </td> <td style="text-align:right;"> 3 </td> <td style="text-align:right;"> 15 </td> <td style="text-align:left;"> Aang </td> <td style="text-align:right;"> 4 </td> </tr> <tr> <td style="text-align:right;"> 1 </td> <td style="text-align:right;"> 4 </td> <td style="text-align:right;"> 15 </td> <td style="text-align:left;"> Aang </td> <td style="text-align:right;"> 7 </td> </tr> <tr> <td style="text-align:right;"> 1 </td> <td style="text-align:right;"> 5 </td> <td style="text-align:right;"> 15 </td> <td style="text-align:left;"> Aang </td> <td style="text-align:right;"> 5 </td> </tr> <tr> <td style="text-align:right;"> 1 </td> <td style="text-align:right;"> 6 </td> <td style="text-align:right;"> 15 </td> <td style="text-align:left;"> Aang </td> <td style="text-align:right;"> 2 </td> </tr> </tbody> </table> ] --- .pull-left[ ```r ggplot(data = appa_data_merged) + geom_segment(aes(x = chapter_seq, xend = chapter_seq, y = 0, yend = appa_mentions_sum)) ``` <br><br> **Add line segments for each chapter and number of Appa mentions** ] .pull-right[ 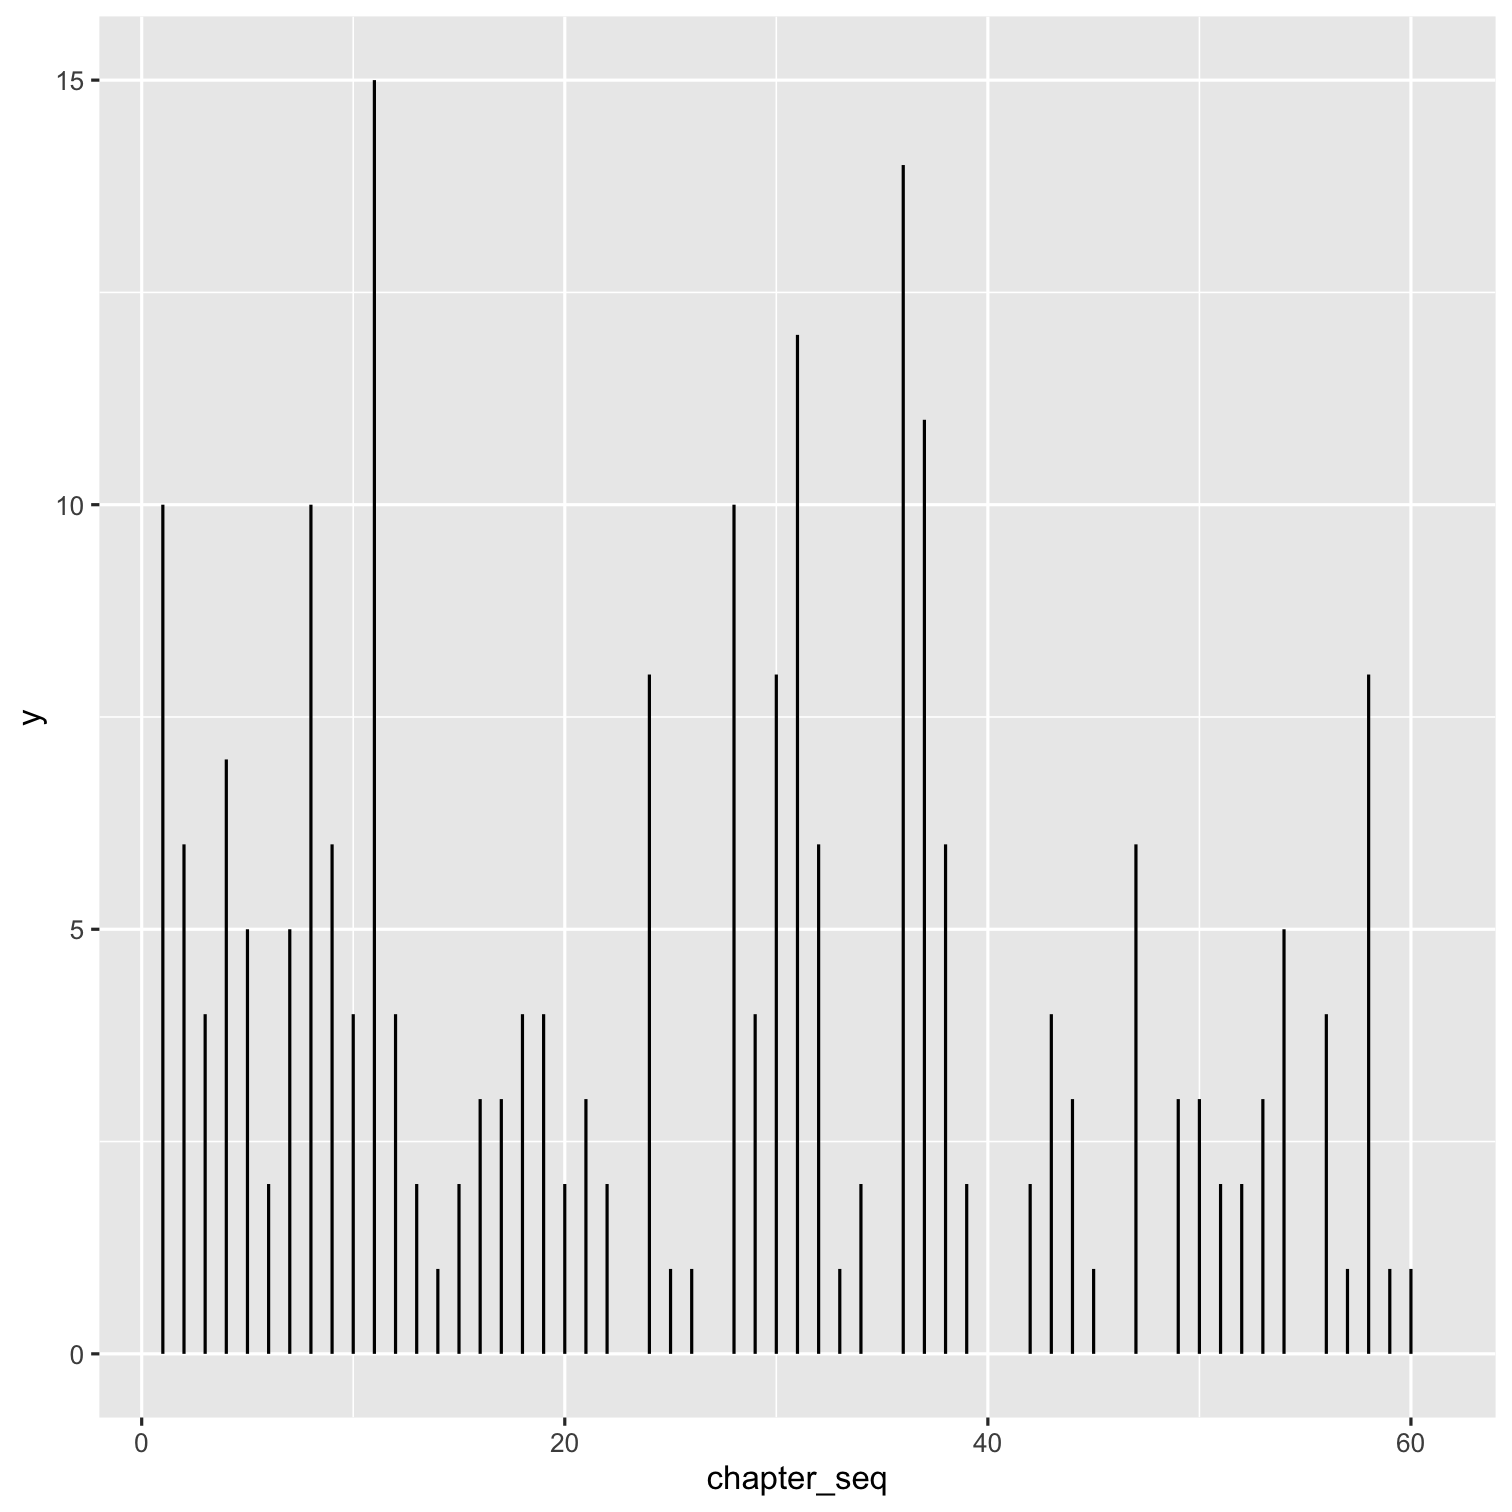 ] --- .pull-left[ ```r ggplot(data = appa_data_merged) + geom_segment(aes(x = chapter_seq, xend = chapter_seq, y = 0, yend = appa_mentions_sum)) + * geom_segment(aes(x = chapter_seq, * xend = chapter_seq, * y = appa_mentions_sum, * yend = mention_max), * linetype = "dotted") ``` <br><br> **Add dashed lines to make all segments equal in height** ] .pull-right[ 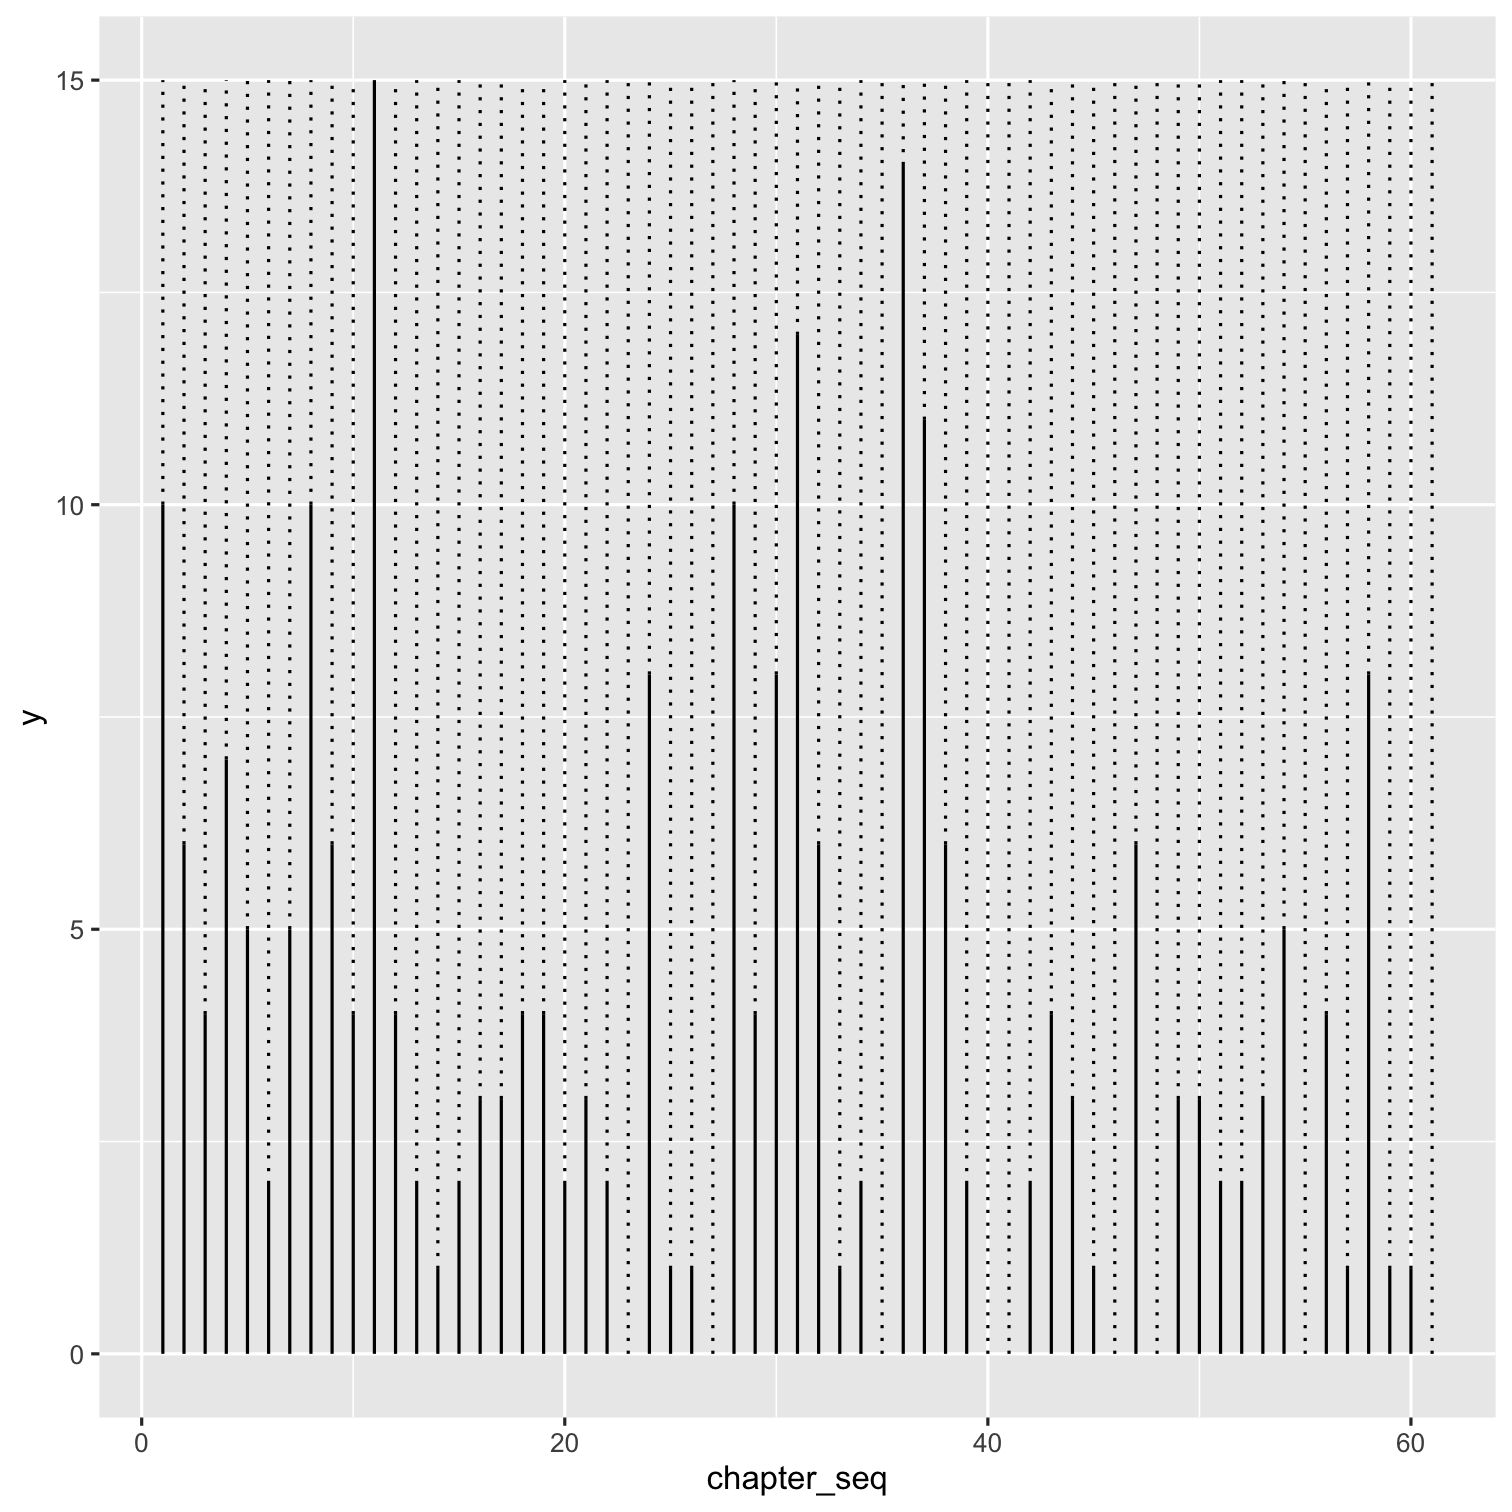 ] --- .pull-left[ ```r ggplot(data = appa_data_merged) + geom_segment(aes(x = chapter_seq, xend = chapter_seq, y = 0, yend = appa_mentions_sum)) + geom_segment(aes(x = chapter_seq, xend = chapter_seq, y = appa_mentions_sum, yend = mention_max), linetype = "dotted") + * geom_image(aes(x = chapter_seq, * y = mention_max + 2, * image = images), * size = 0.03) ``` <br><br> **Adding image to indicate book type** ] .pull-right[ 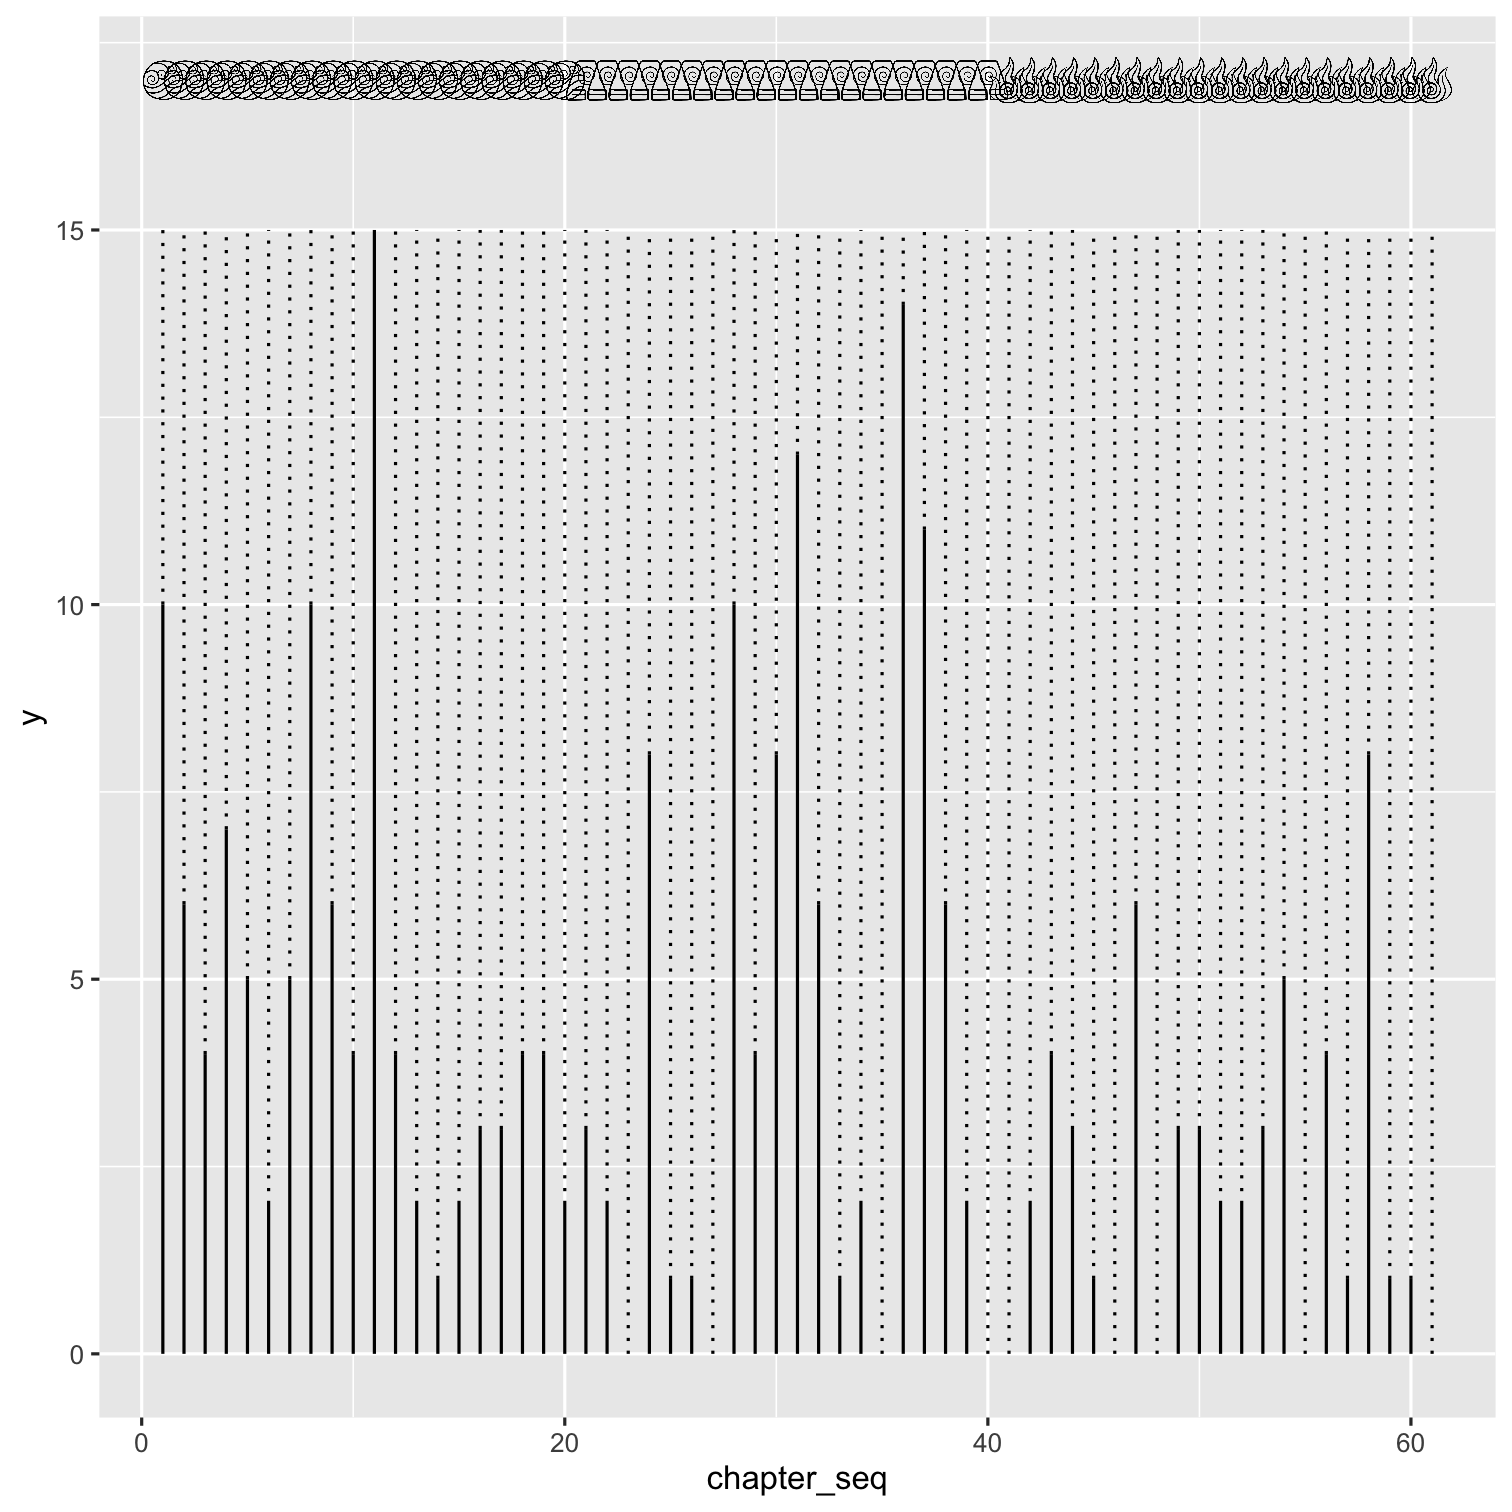 ] --- .pull-left[ ```r ggplot(data = appa_data_merged) + geom_segment(aes(x = chapter_seq, xend = chapter_seq, y = 0, yend = appa_mentions_sum)) + geom_segment(aes(x = chapter_seq, xend = chapter_seq, y = appa_mentions_sum, yend = mention_max), linetype = "dotted") + geom_image(aes(x = chapter_seq, y = mention_max + 2, image = images), size = 0.03) + * coord_polar() ``` <br><br> **Changing to polar coordinate system** Do you notice that the icons overlap at the top of the circle? ] .pull-right[ 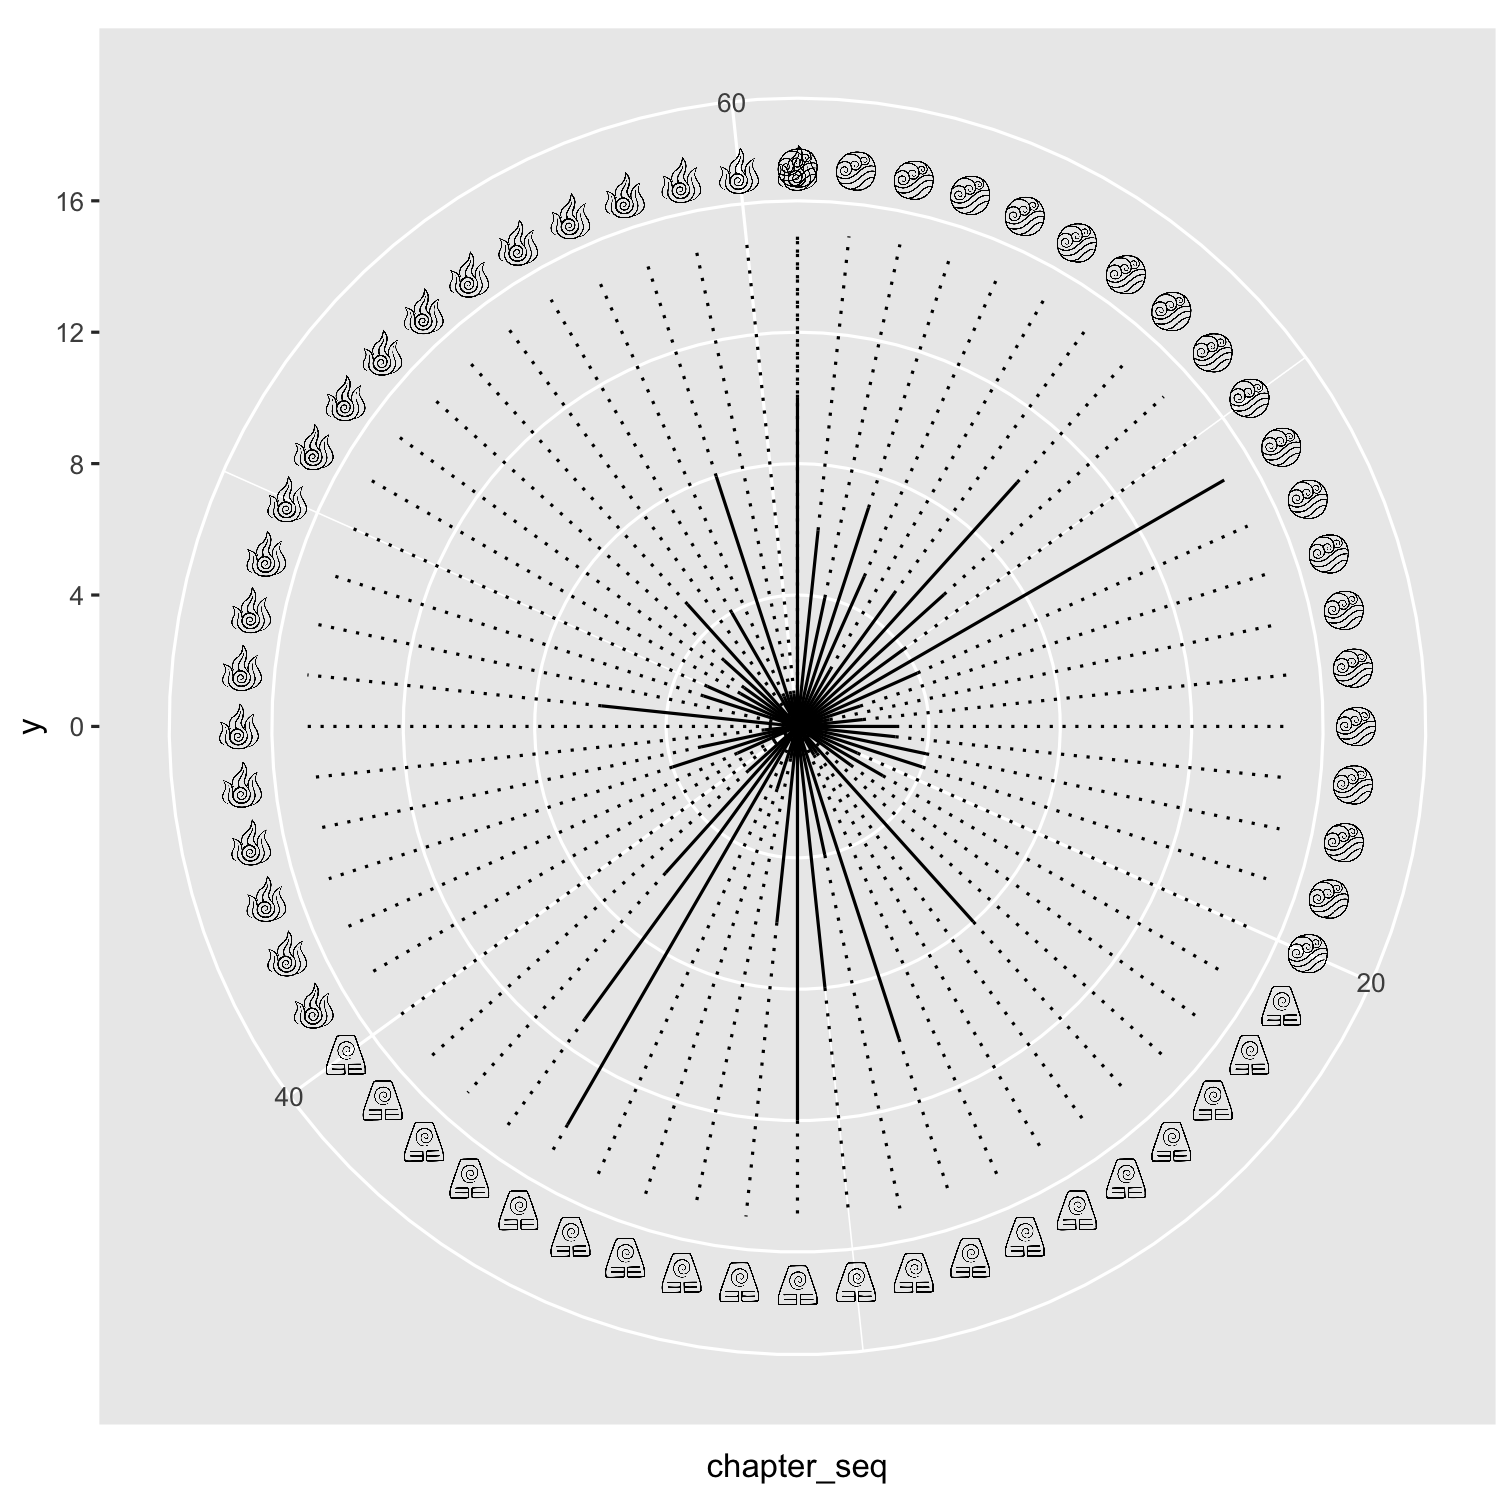 ] --- .pull-left[ ```r ggplot(data = appa_data_merged) + geom_segment(aes(x = chapter_seq, xend = chapter_seq, y = 0, yend = appa_mentions_sum)) + geom_segment(aes(x = chapter_seq, xend = chapter_seq, y = appa_mentions_sum, yend = mention_max), linetype = "dotted") + geom_image(aes(x = chapter_seq, y = mention_max + 2, image = images), size = 0.03) + coord_polar() + * xlim(0, 61) ``` <br><br> **Expanding x-axis to remove overlap** We want to have a distinct inner circle similarly to the computational art piece. ] .pull-right[ 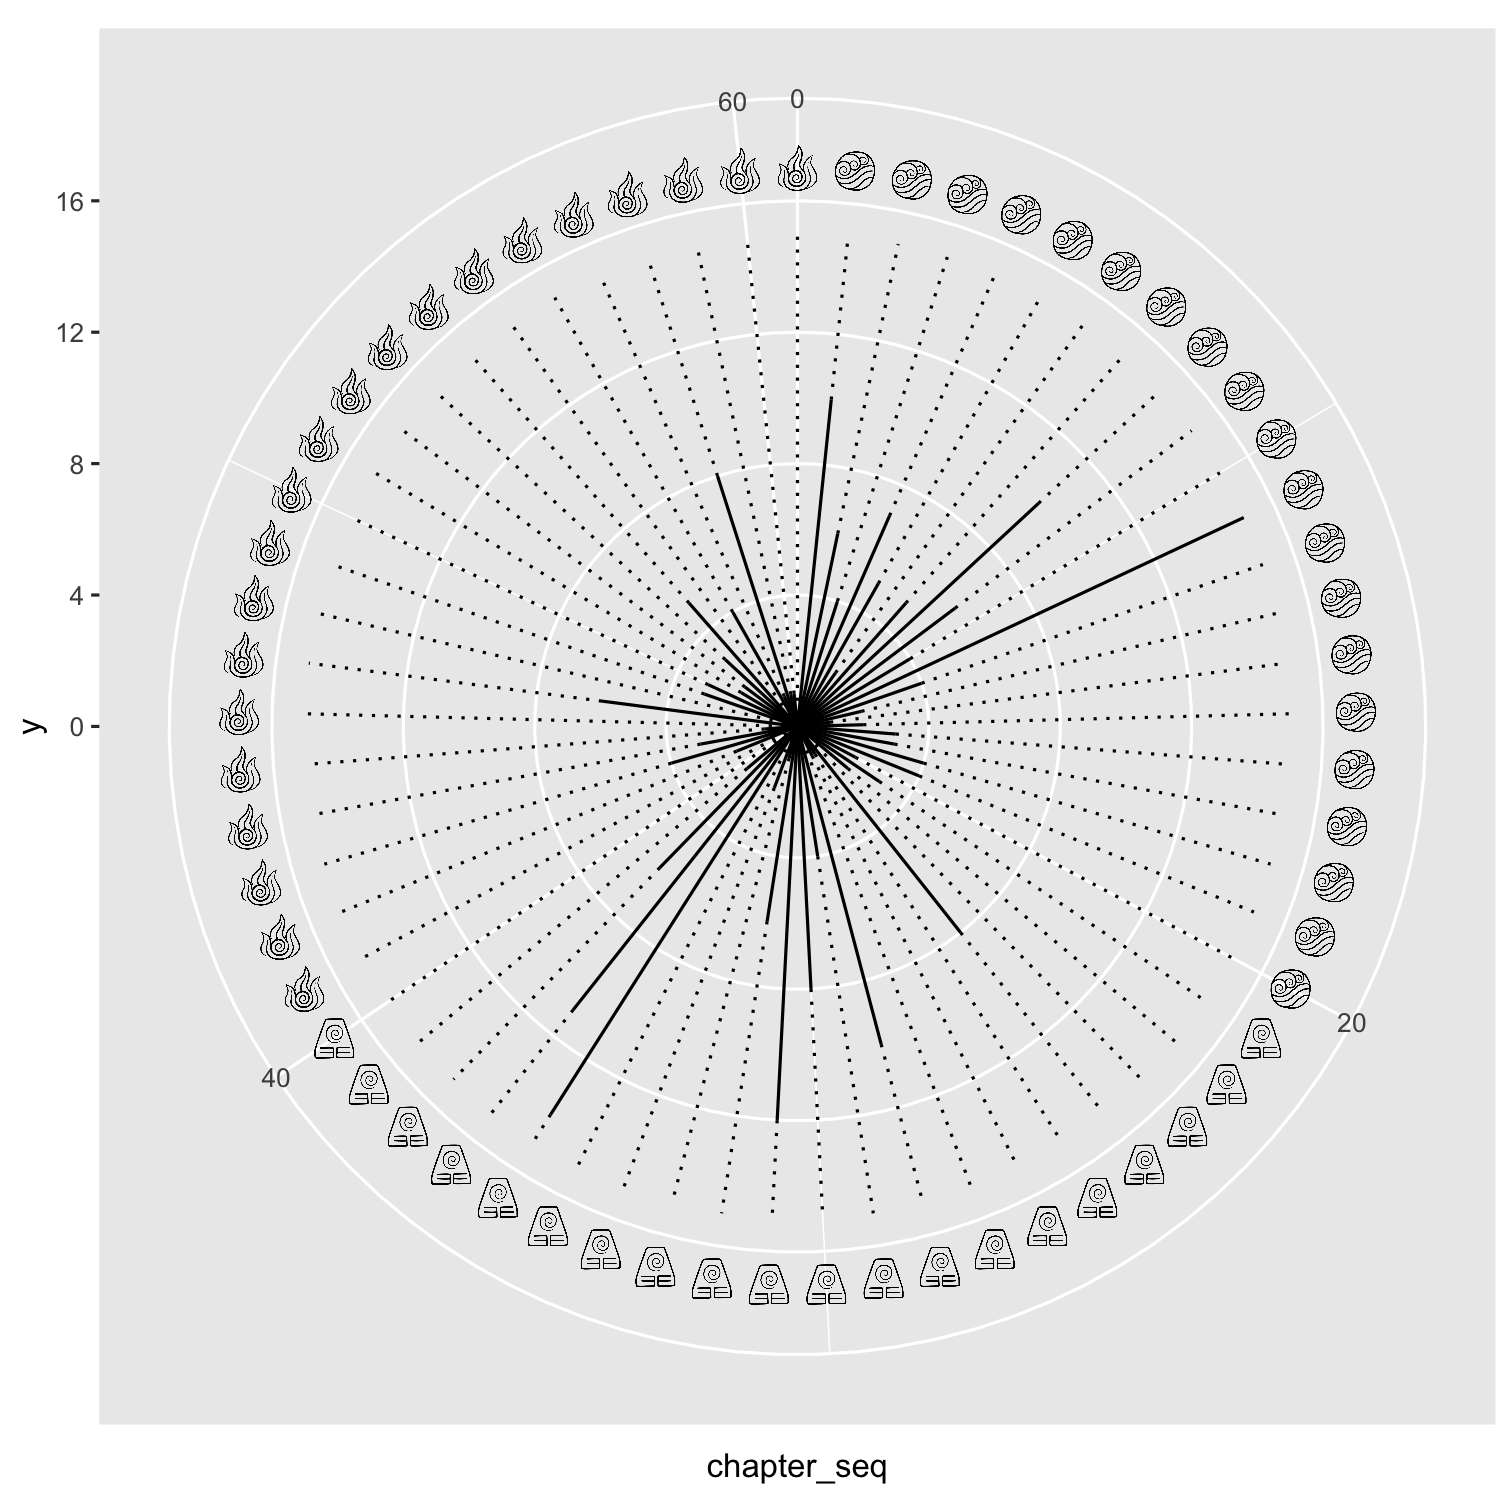 ] --- .pull-left[ ```r ggplot(data = appa_data_merged) + geom_segment(aes(x = chapter_seq, xend = chapter_seq, y = 0, yend = appa_mentions_sum)) + geom_segment(aes(x = chapter_seq, xend = chapter_seq, y = appa_mentions_sum, yend = mention_max), linetype = "dotted") + geom_image(aes(x = chapter_seq, y = mention_max + 2, image = images), size = 0.03) + coord_polar() + xlim(0, 61) + * ylim(-15,35) ``` <br><br> **Expand y-axis to have center circle** ] .pull-right[ 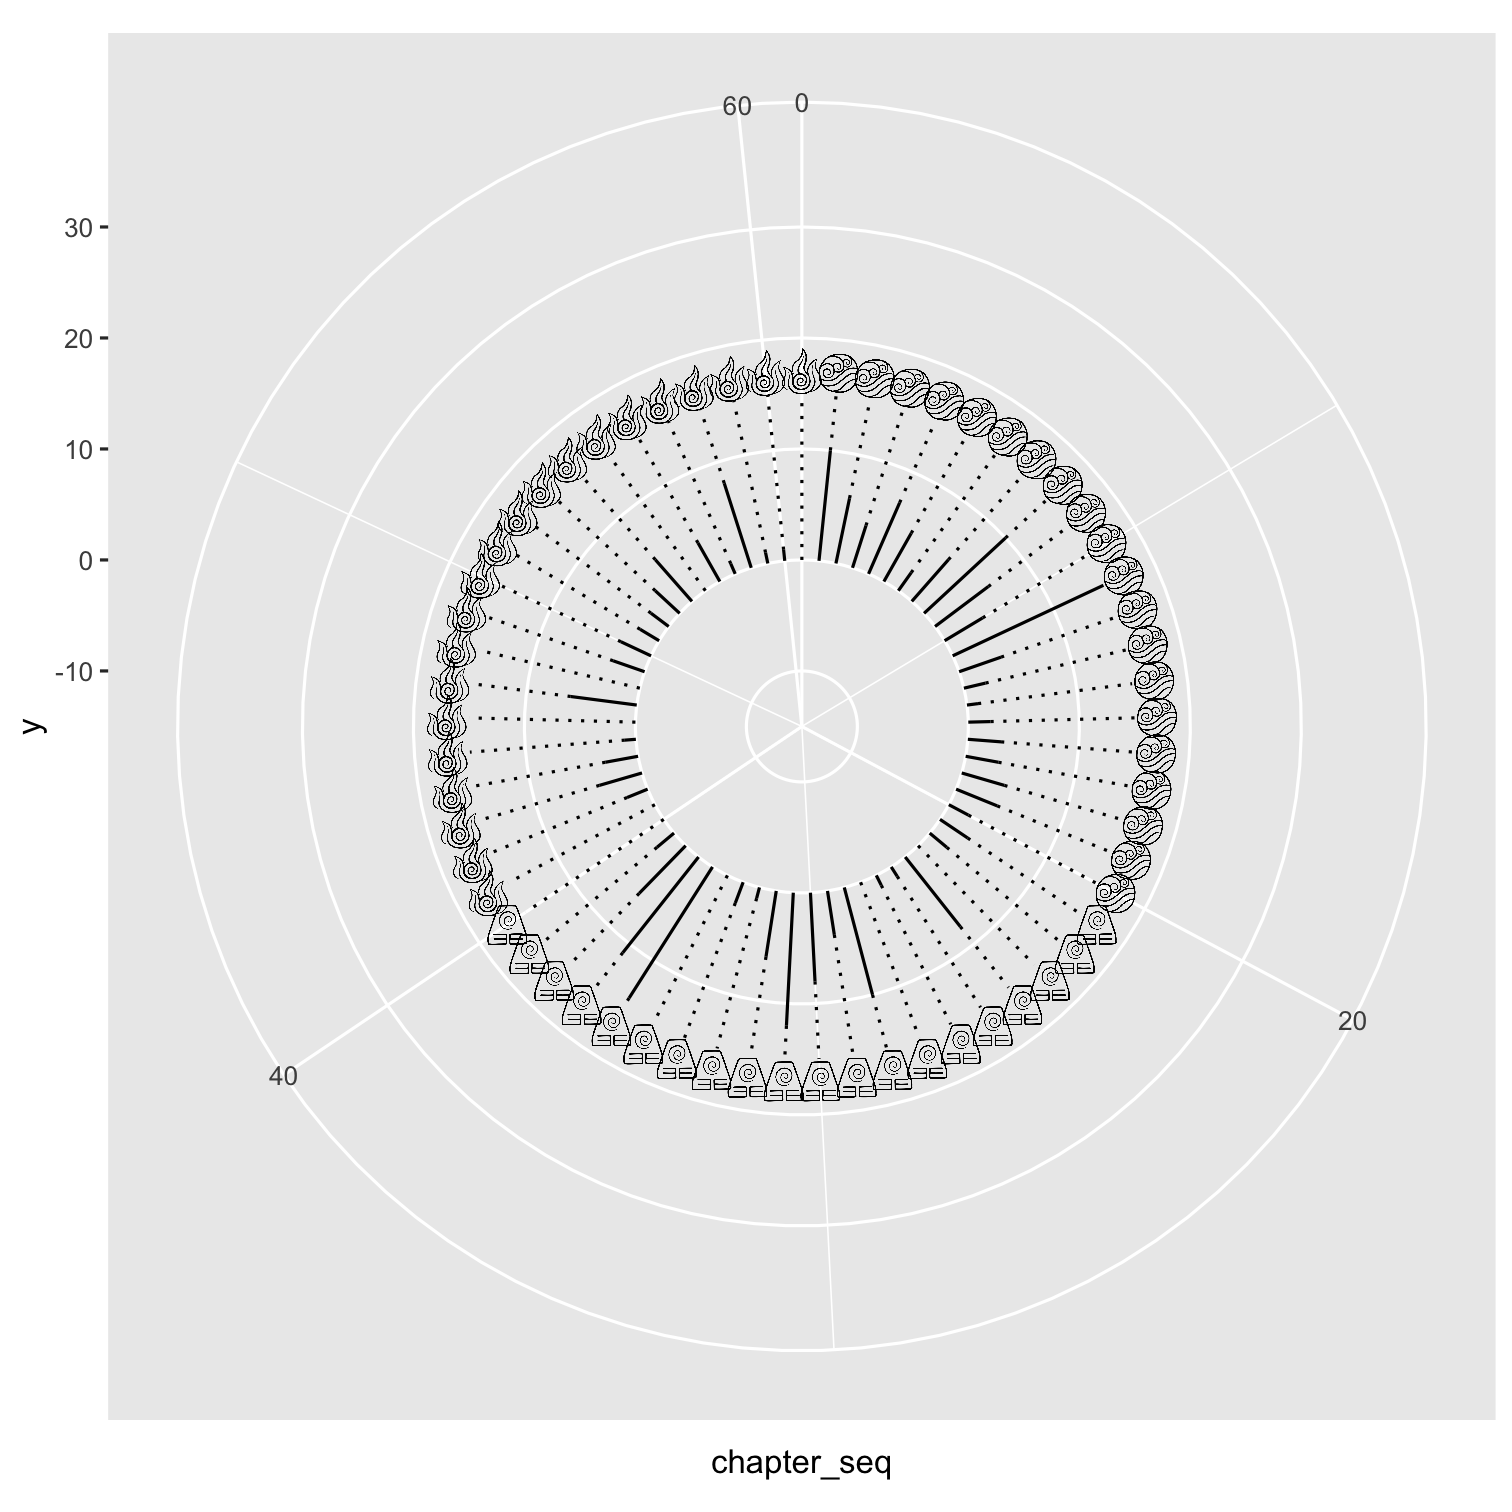 ] --- .pull-left[ ```r ggplot(data = appa_data_merged) + geom_segment(aes(x = chapter_seq, xend = chapter_seq, y = 0, yend = appa_mentions_sum)) + geom_segment(aes(x = chapter_seq, xend = chapter_seq, y = appa_mentions_sum, yend = mention_max), linetype = "dotted") + geom_image(aes(x = chapter_seq, y = mention_max + 2, image = images), size = 0.03) + * geom_segment(aes(x = 0, * xend = 61, * y = 0, * yend = 0)) + # coord_polar() + xlim(0, 61) + ylim(-15,35) ``` <br><br> **Add a horizontal segment** ] .pull-right[ 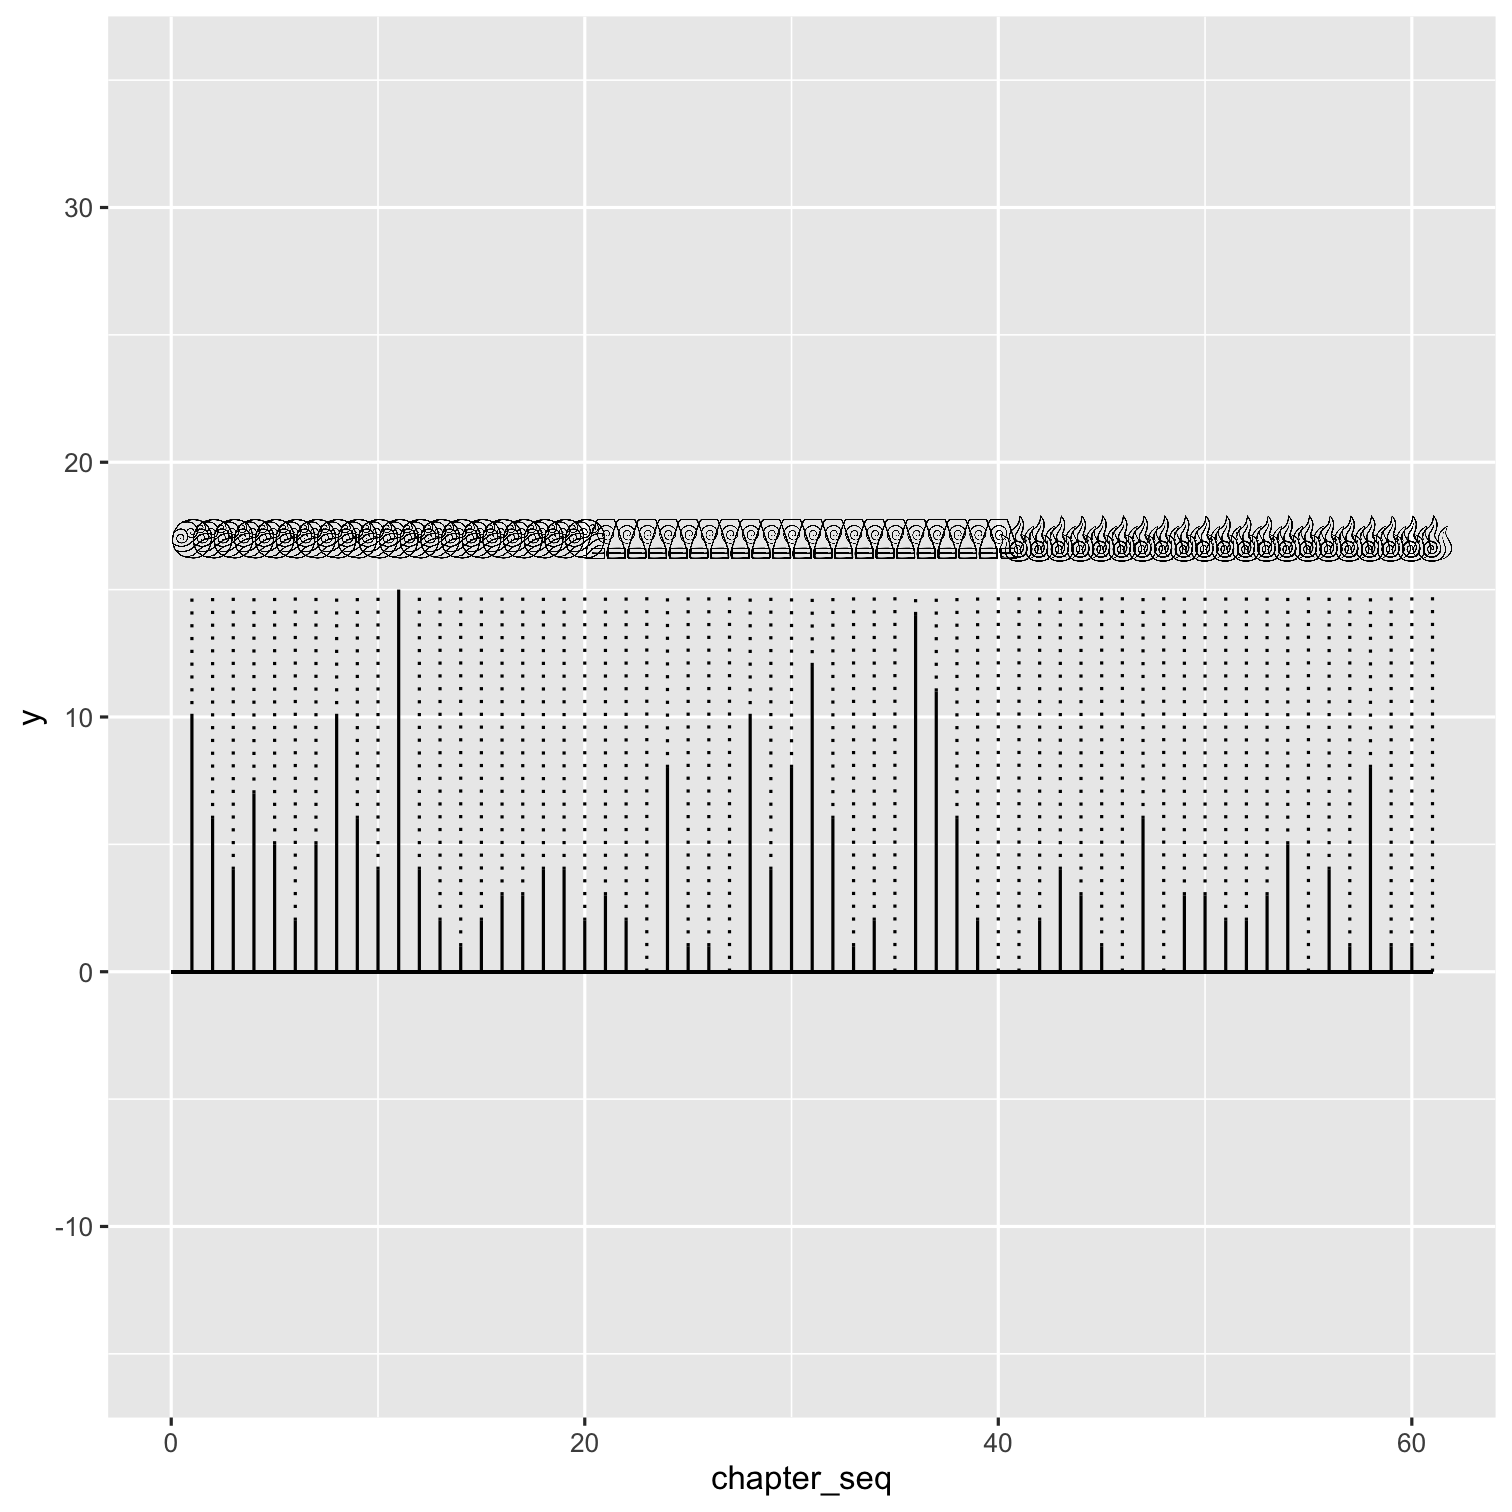 ] --- .pull-left[ ```r ggplot(data = appa_data_merged) + geom_segment(aes(x = chapter_seq, xend = chapter_seq, y = 0, yend = appa_mentions_sum)) + geom_segment(aes(x = chapter_seq, xend = chapter_seq, y = appa_mentions_sum, yend = mention_max), linetype = "dotted") + geom_image(aes(x = chapter_seq, y = mention_max + 2, image = images), size = 0.03) + * geom_segment(aes(x = 0, * xend = 61, * y = 0, * yend = 0)) + coord_polar() + xlim(0, 61) + ylim(-15,35) ``` <br><br> **Now have a "path" inner circle** ] .pull-right[ 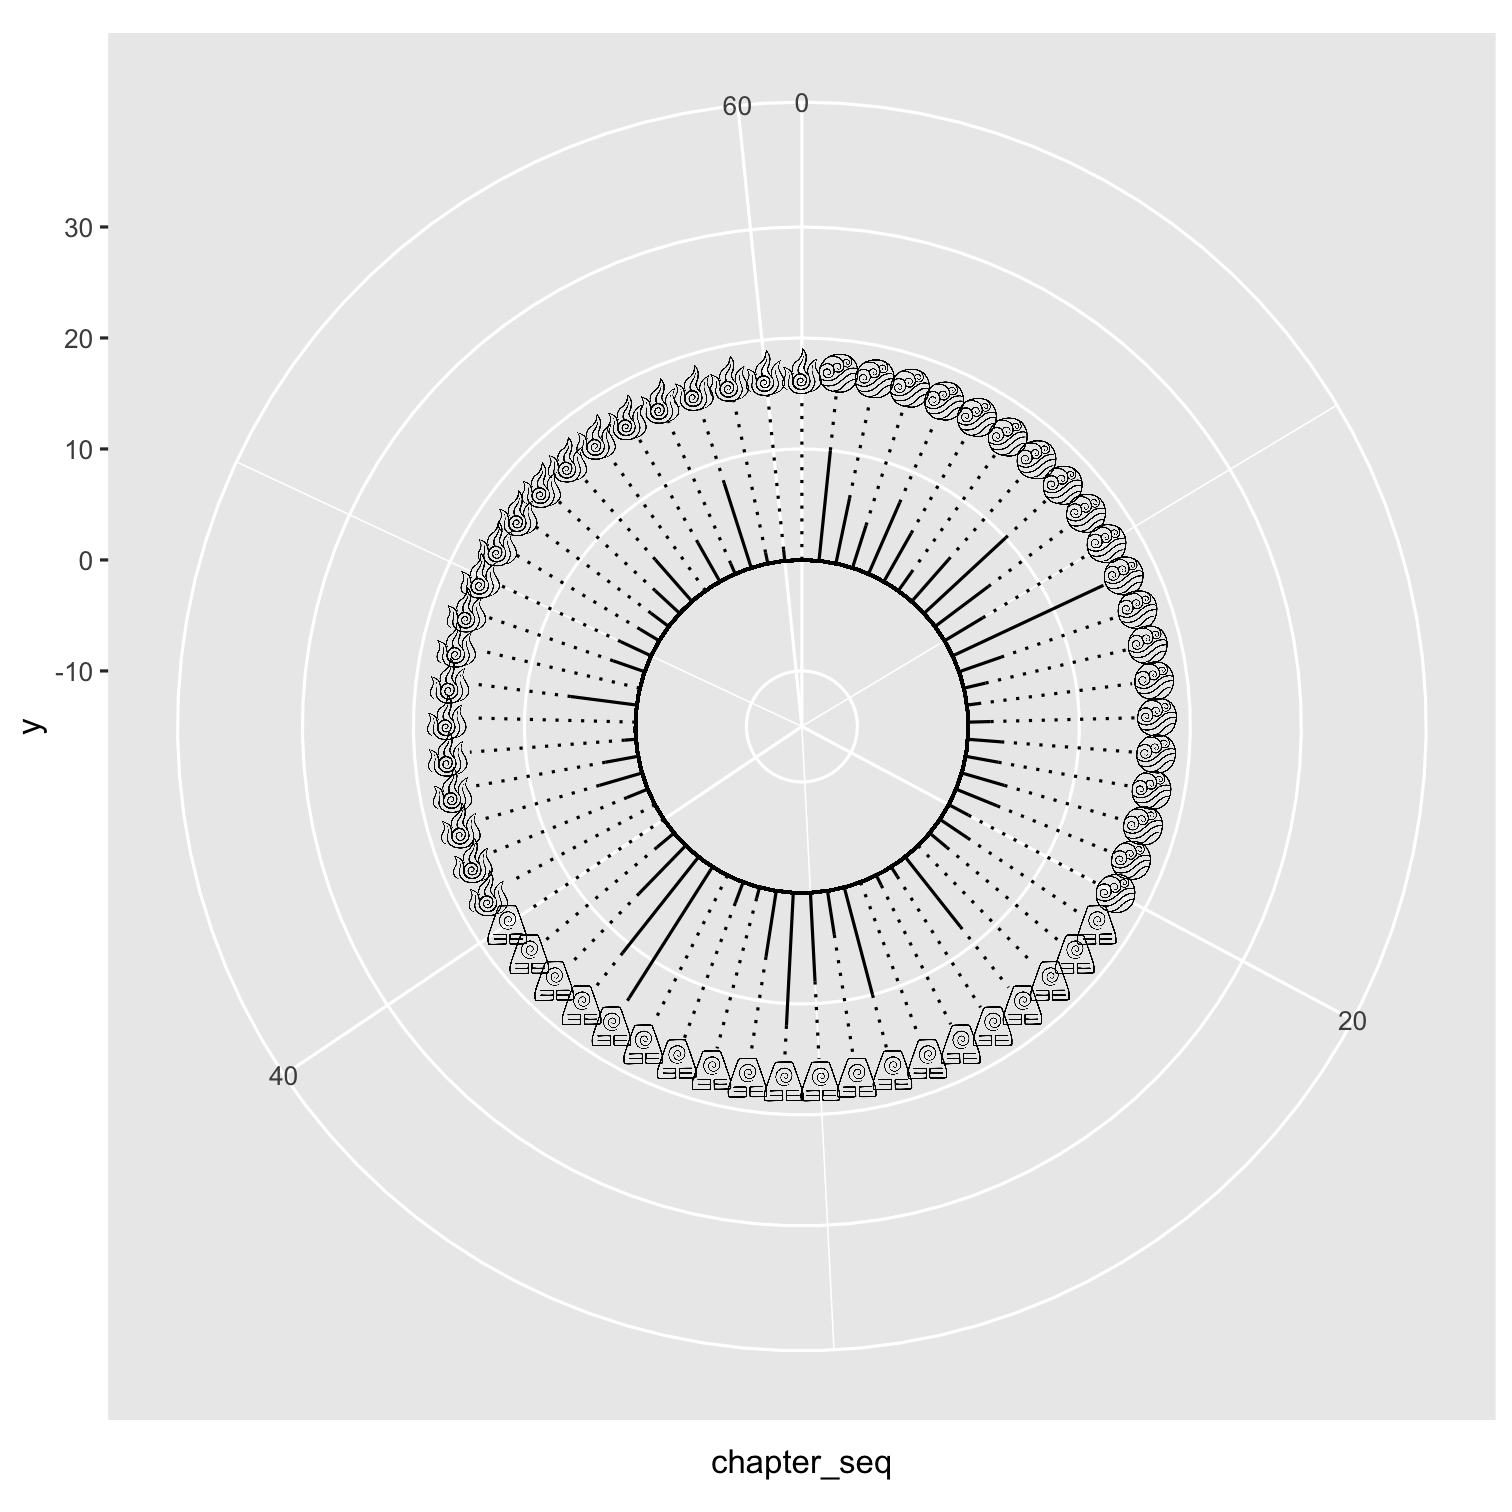 ] --- .pull-left[ ```r ggplot(data = appa_data_merged) + geom_segment(aes(x = chapter_seq, xend = chapter_seq, y = 0, yend = appa_mentions_sum)) + geom_segment(aes(x = chapter_seq, xend = chapter_seq, y = appa_mentions_sum, yend = mention_max), linetype = "dotted") + geom_image(aes(x = chapter_seq, y = mention_max + 2, image = images), size = 0.03) + geom_segment(aes(x = 0, xend = 61, y = 0, yend = 0)) + * geom_image(aes(x = 30, * y = -15, * image = appa_img), * size = .25) + #coord_polar() + xlim(0, 61) + ylim(-15,35) ``` <br> **Add an Appa image to center of visualization** ] .pull-right[ 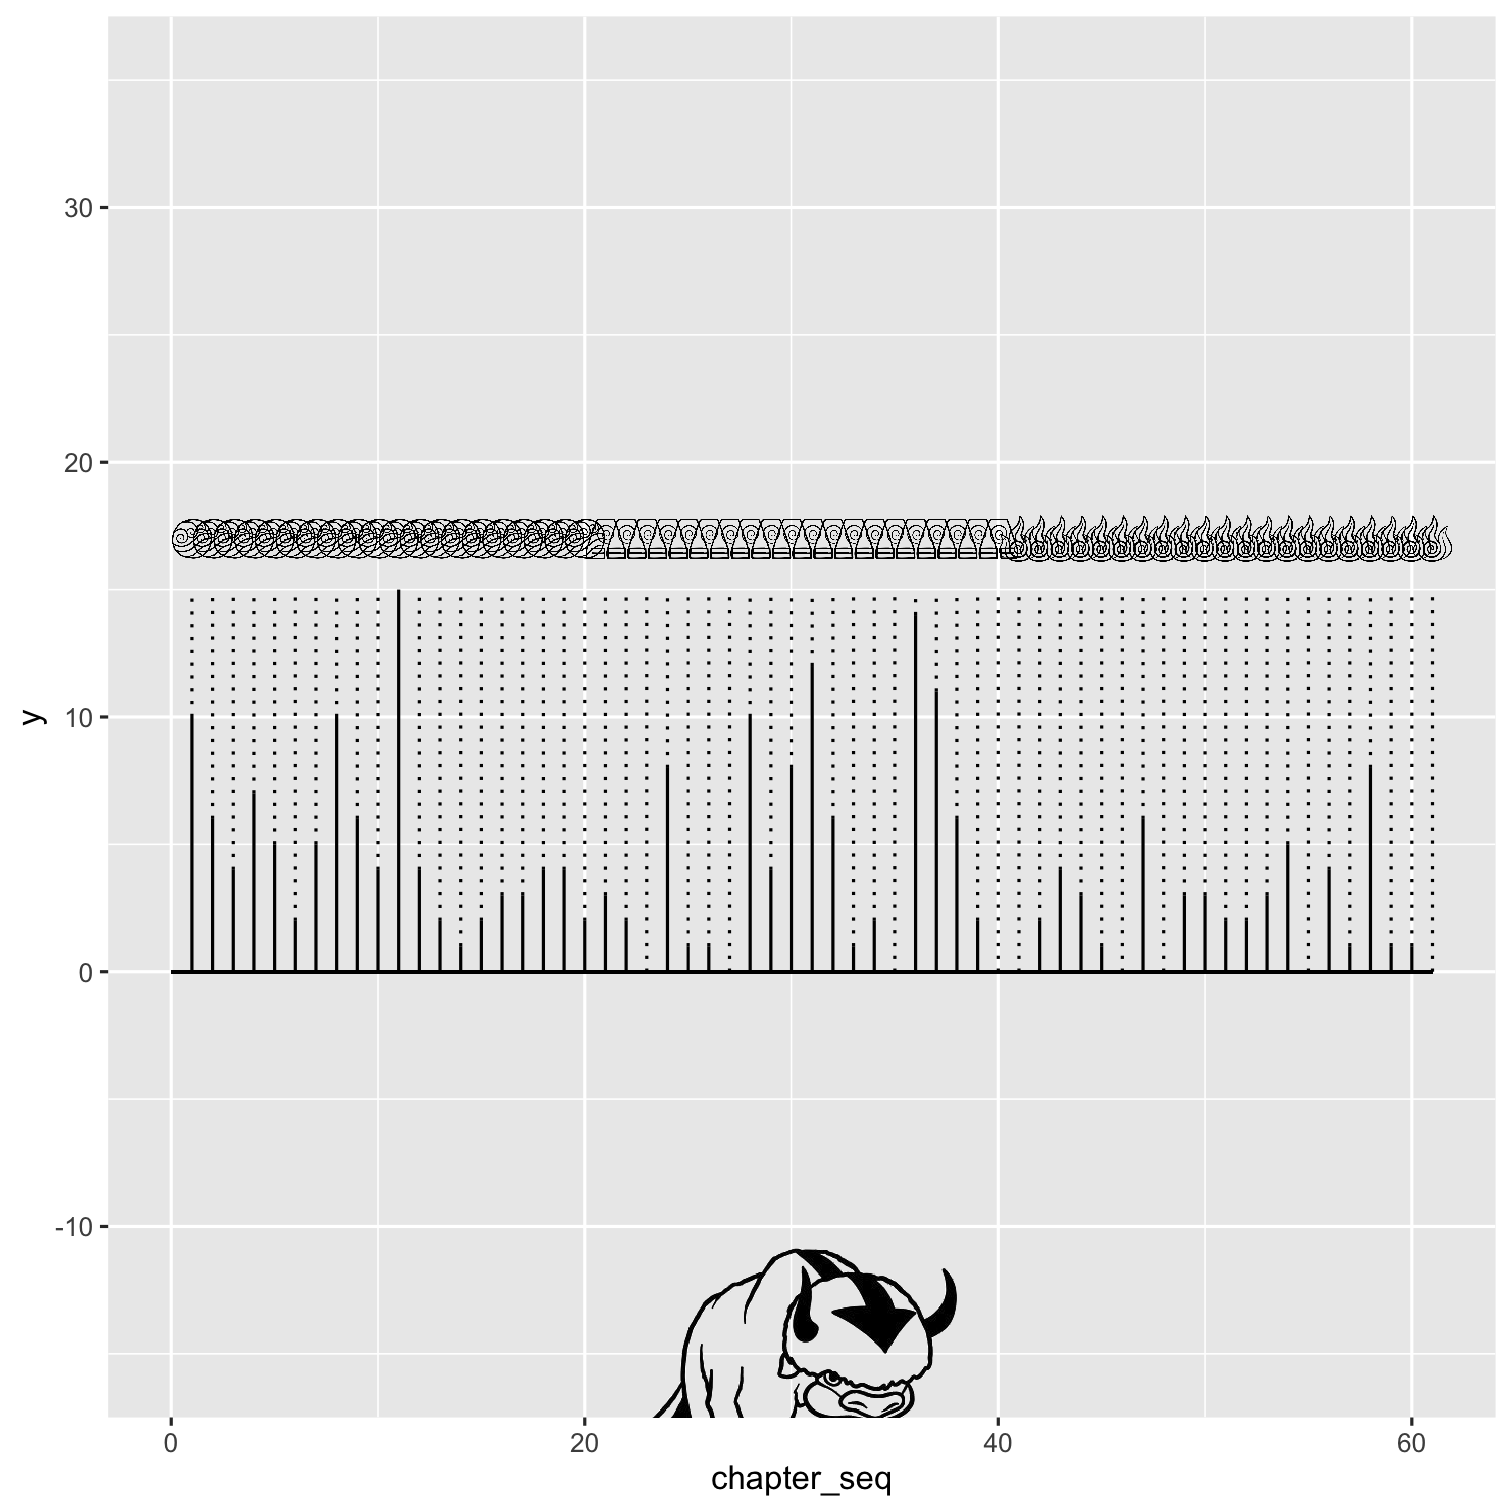 ] --- .pull-left[ ```r ggplot(data = appa_data_merged) + geom_segment(aes(x = chapter_seq, xend = chapter_seq, y = 0, yend = appa_mentions_sum)) + geom_segment(aes(x = chapter_seq, xend = chapter_seq, y = appa_mentions_sum, yend = mention_max), linetype = "dotted") + geom_image(aes(x = chapter_seq, y = mention_max + 2, image = images), size = 0.03) + geom_segment(aes(x = 0, xend = 61, y = 0, yend = 0)) + * geom_image(aes(x = 30, * y = -15, * image = appa_img), * size = .25) + * coord_polar() + xlim(0, 61) + ylim(-15,35) ``` <br> **Add an Appa image to center of visualization** ] .pull-right[ 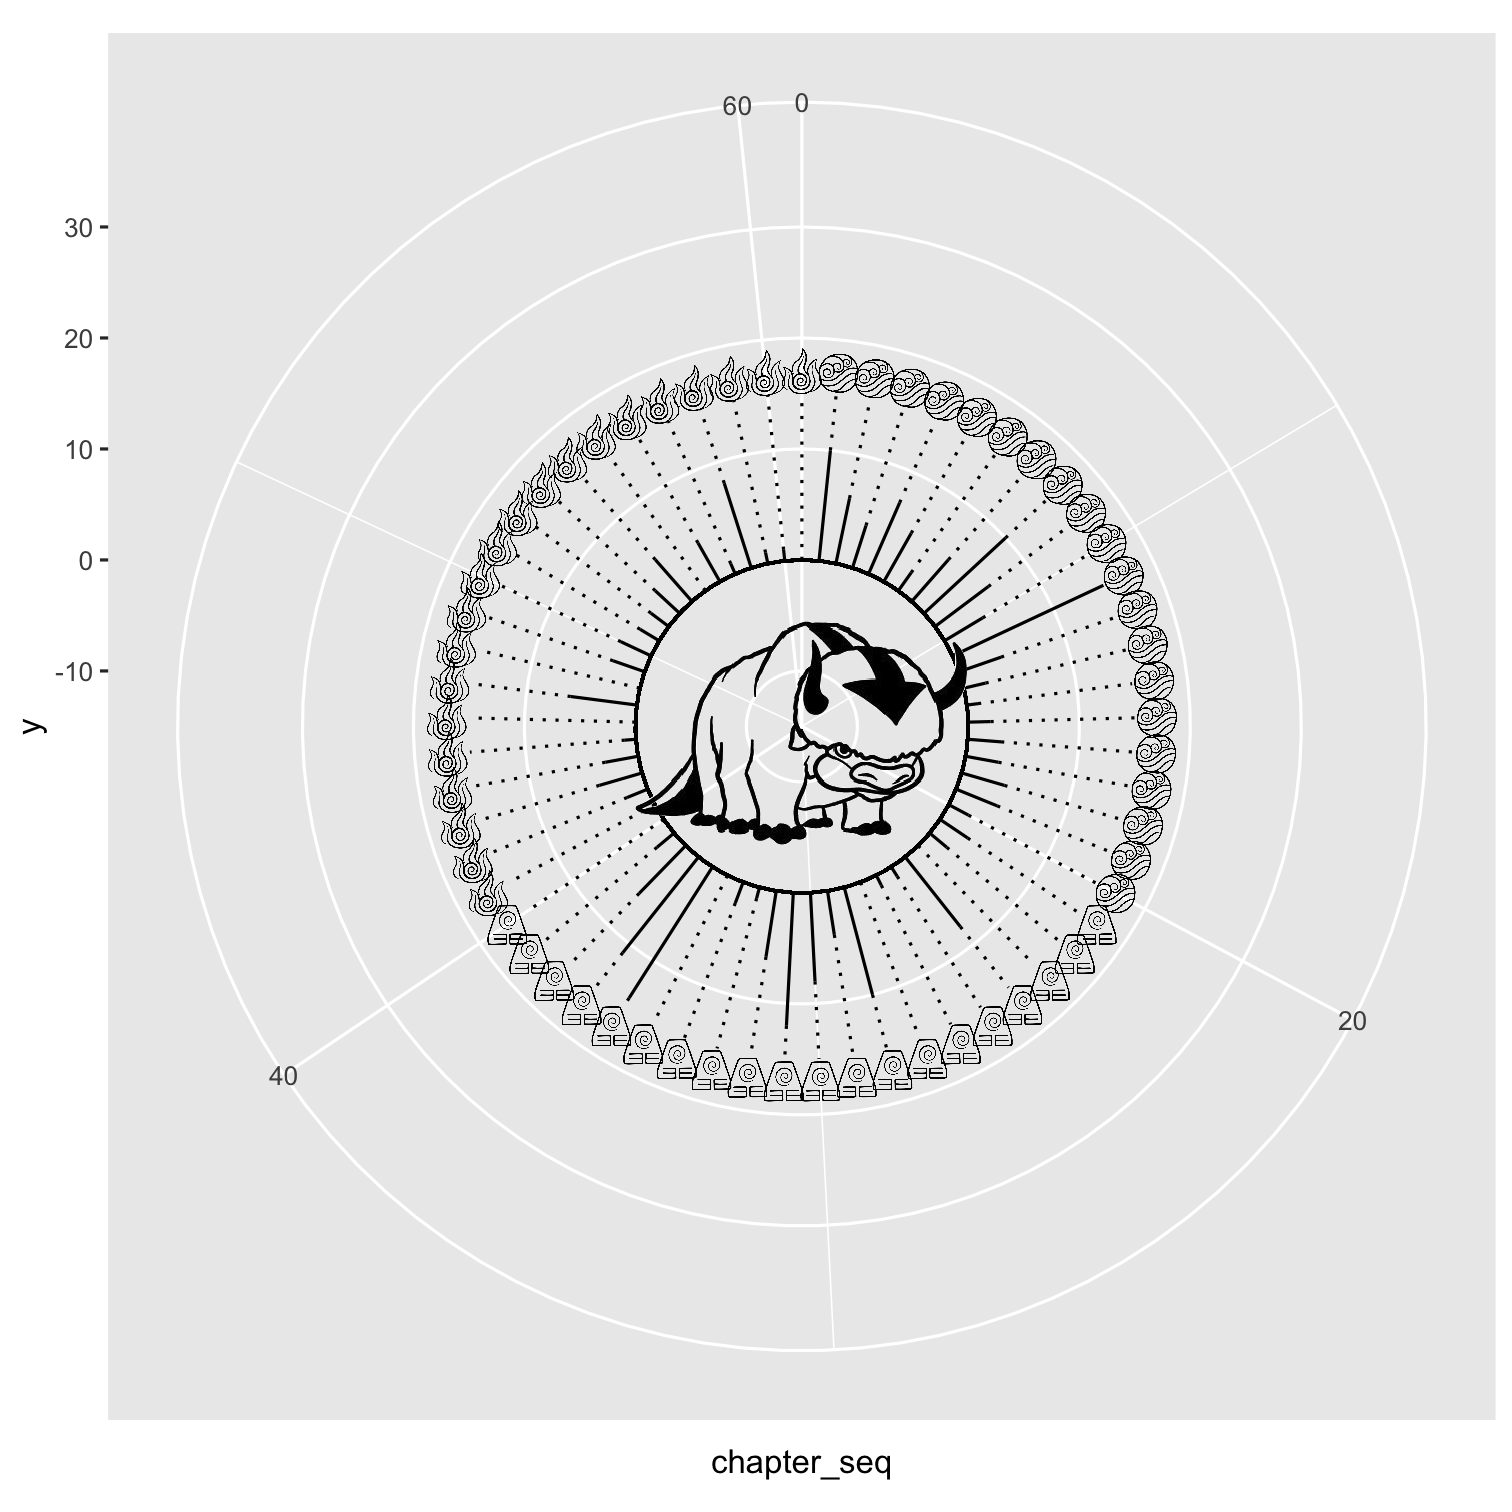 ] --- .pull-left[ ```r appa_plot + * geom_text(aes(x = chapter_seq, * y = 31, * label = paste0(character, " ", * book_num, ".", * chapter_num), * angle = angle), * size = 3.5) + coord_polar() + xlim(0, 61) + ylim(-15,35) ``` <br><br> **Add character, book, and chapter number label** ] .pull-right[ 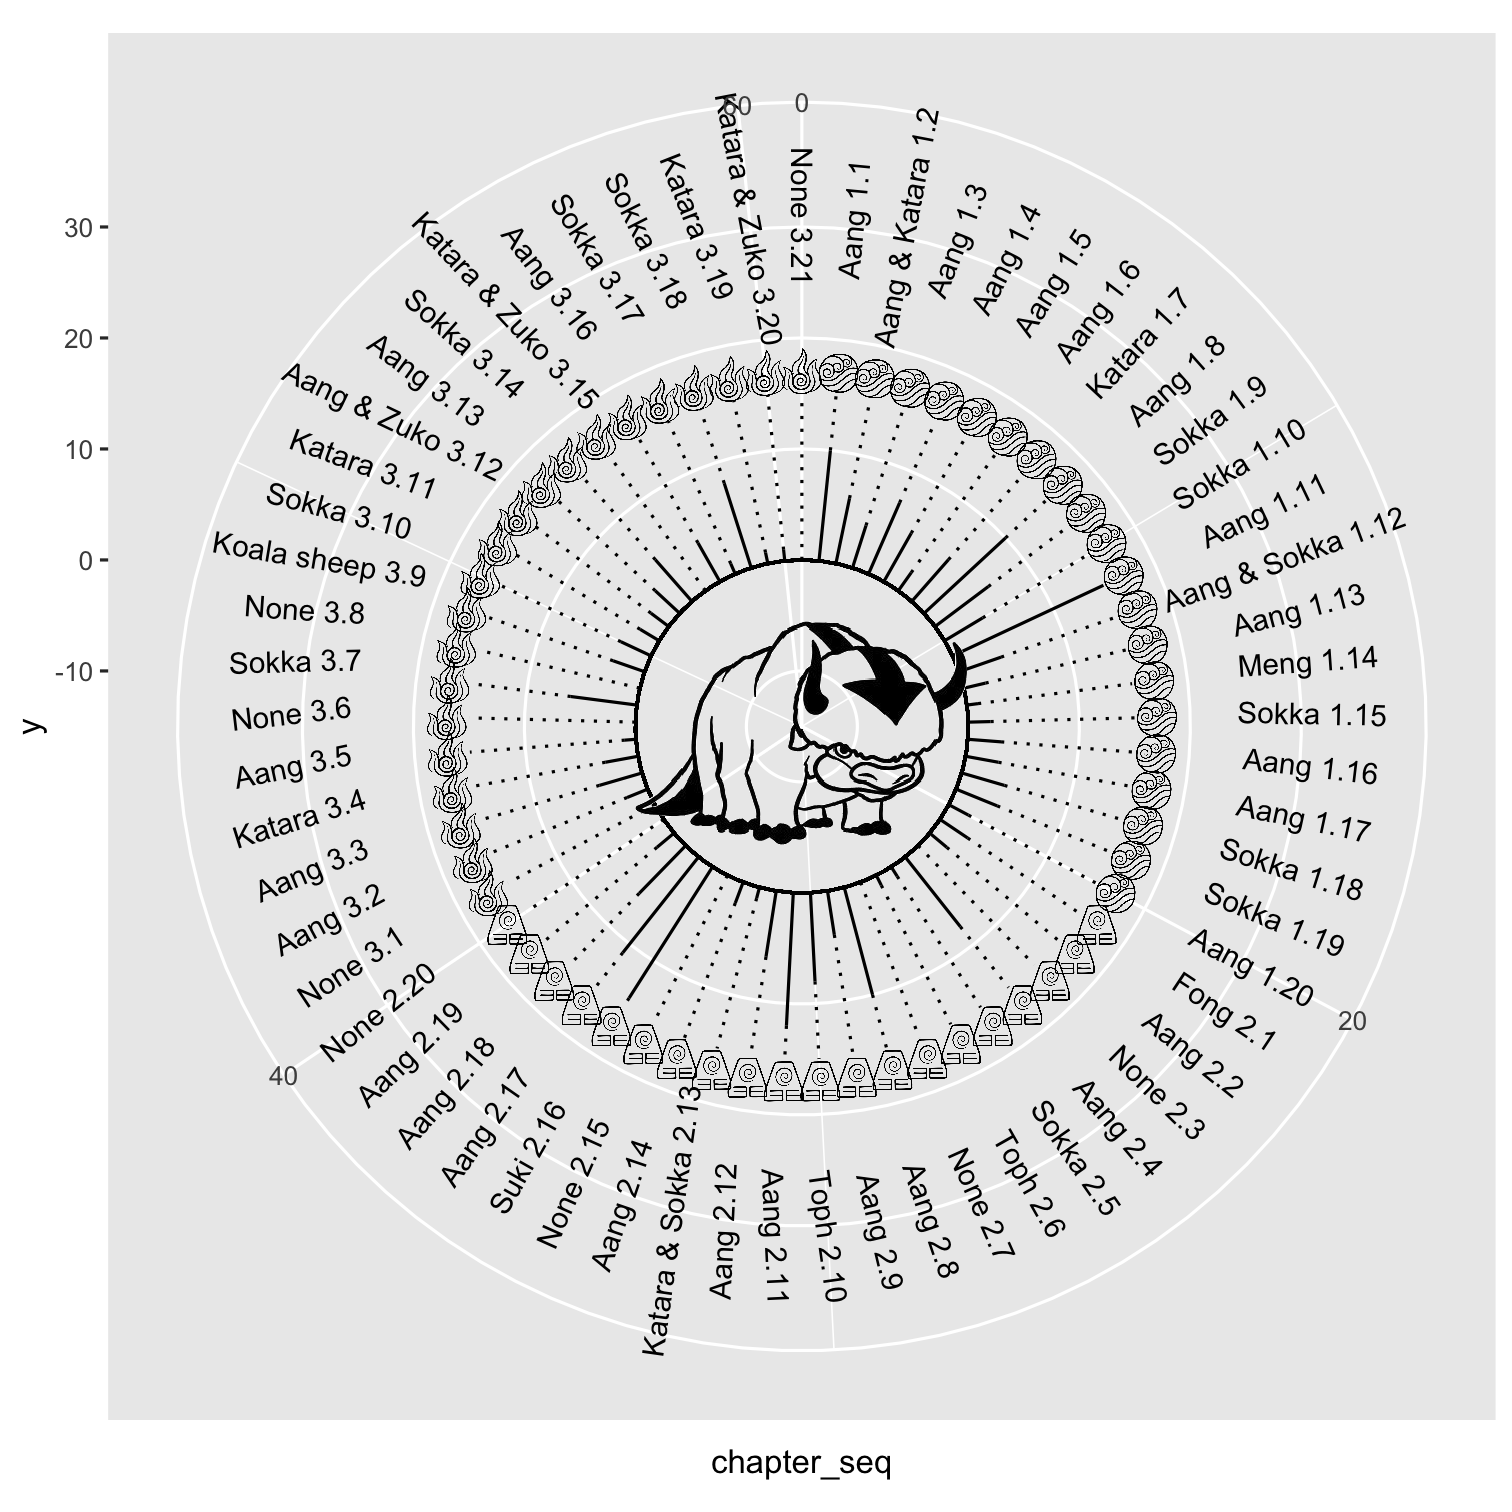 ] --- .pull-left[ ```r appa_plot + geom_text(aes(x = chapter_seq, y = 31, label = paste0(character, " ", book_num, ".", chapter_num), angle = angle), size = 3.5) + coord_polar() + xlim(0, 61) + ylim(-15,35) + * theme(text = element_text( * family = "Lora"), * panel.background = element_rect( * fill = "#e1d2c0"), * plot.background = element_rect( * fill = "#e1d2c0", * colour = "#0f0d0d", * size = 4), * panel.grid = element_blank(), * axis.text = element_blank(), * axis.title = element_blank(), * axis.ticks = element_blank()) ``` ] .pull-right[ 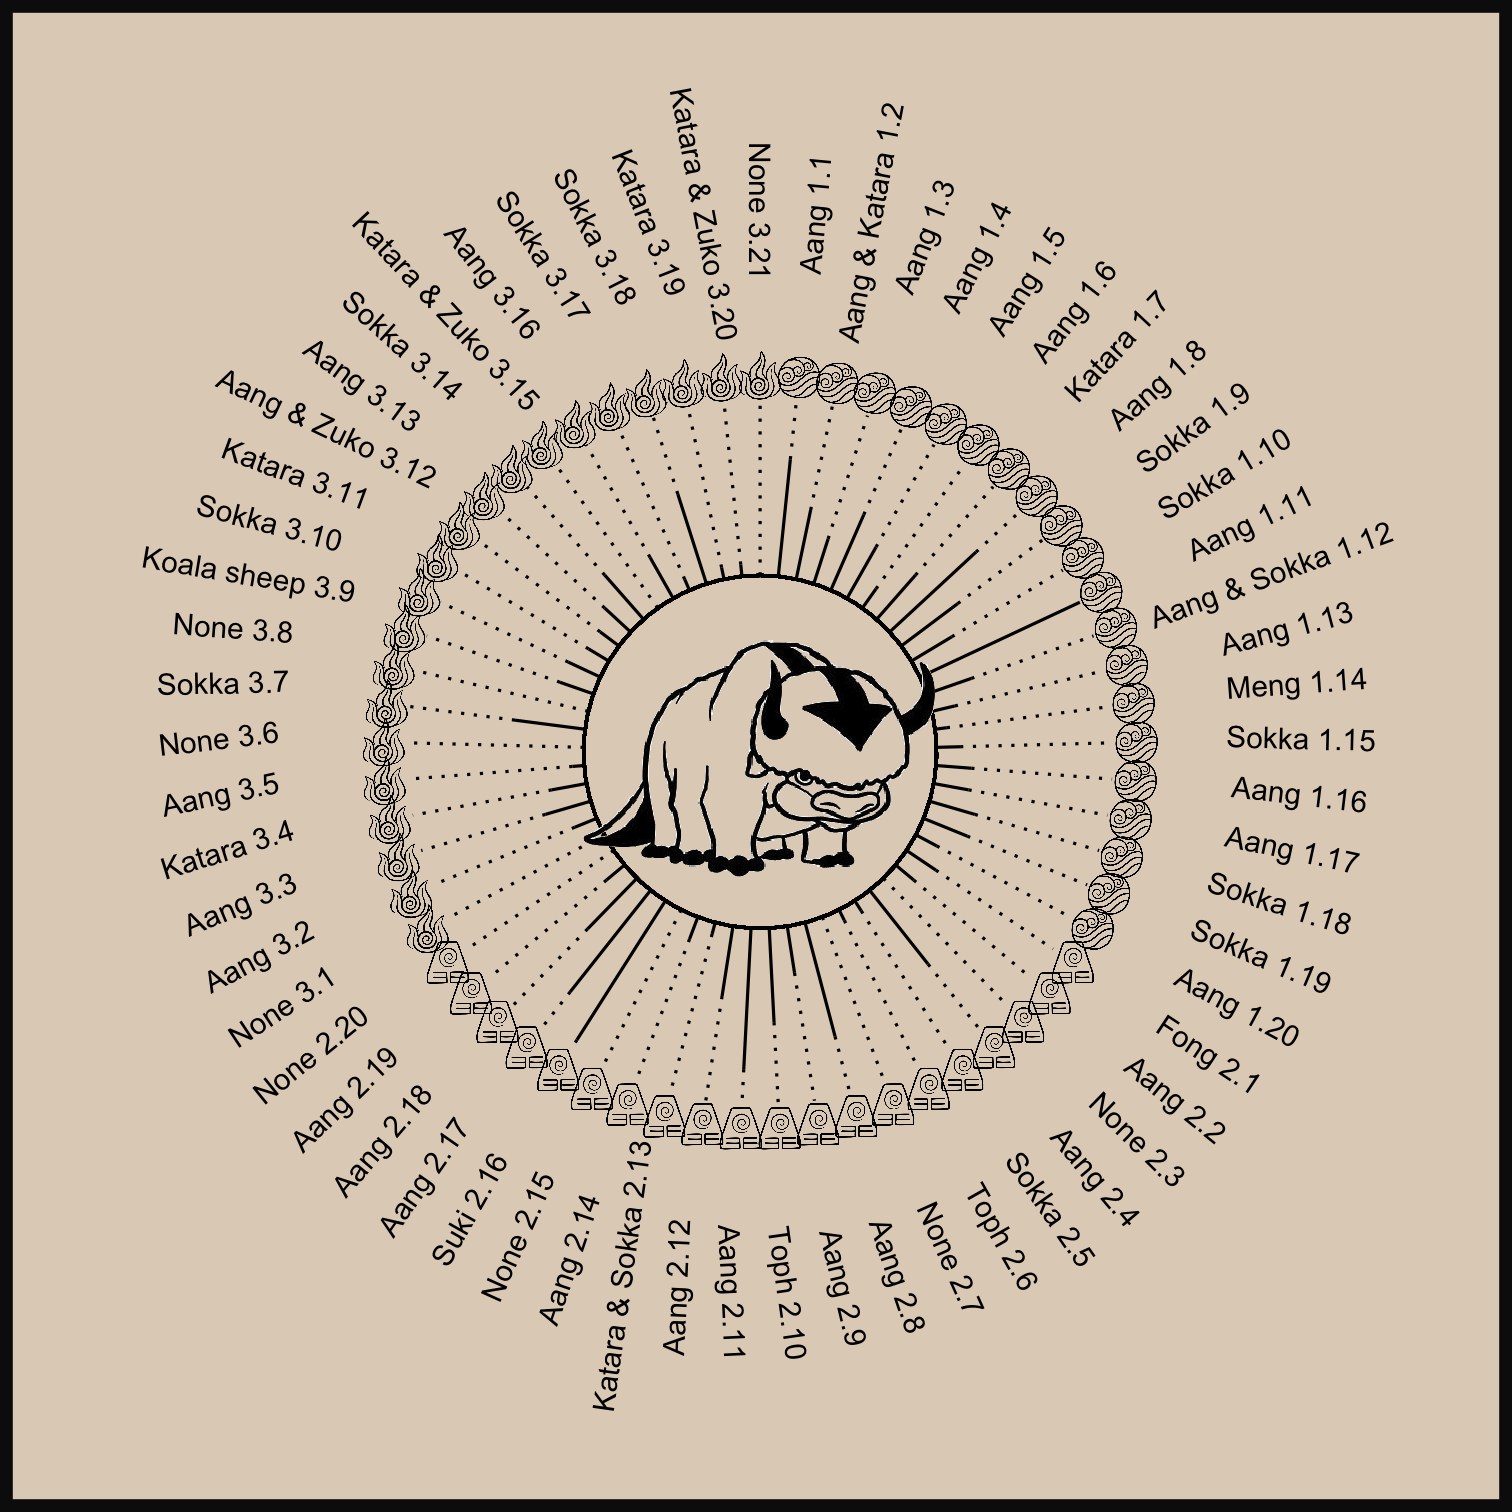 ] --- class: transition-slide-blue, middle .my-white[ # Let's revisit the visualizations ] --- .pull-left[ <img src="index_files/figure-html/unnamed-chunk-32-1.png" width="504" style="display: block; margin: auto;" /> .center[ ### Computational Art: First Pattern ] ] .pull-right[ <img src="index_files/figure-html/unnamed-chunk-33-1.png" width="504" style="display: block; margin: auto;" /> .center[ ### TidyTuesday: DataViz ] ] --- .pull-left[ <img src="index_files/figure-html/unnamed-chunk-34-1.png" width="504" style="display: block; margin: auto;" /> .center[ ### Computational Art: Second Pattern ] ] .pull-right[ <img src="index_files/figure-html/unnamed-chunk-35-1.png" width="504" style="display: block; margin: auto;" /> .center[ ### TidyTuesday: DataViz ] ] --- class: center, middle, transition-slide-blue .my-white[ ### You can do computational art! If not for fun, then to improve your data visualization skills! ]  --- class: center, middle, transition-gradient-blue .pull-left[ .my-white[ # Waffles says thank you for attending! <br> ### twitter: @ijeamaka_a ### github: ijeamakaa/aRt_ggplot_slides ] ] .pull-right[ <img src="images/waffles.jpg" width="70%" style="display: block; margin: auto;" /> ]